
Is Brinker International (EAT) Still Attractive After Strong Five-Year Share Price Performance?
- If you are wondering whether Brinker International at around US$152 per share offers solid value or is pricing in too much optimism, you are not alone.
- The stock shows returns of 5.8% over 7 days, 6.6% over 30 days, 0.5% year to date and 17.1% over 1 year, with a very large 3 year gain and a 139.9% return over 5 years that many long term holders will be watching closely.
- Recent coverage has focused on how Brinker International is positioned within the Hospitality sector and what current sentiment implies for consumer facing names, giving investors more context for these share price moves. Commentary has also highlighted how management is responding to cost pressures and competition, which can influence how the market views the stock.
- On Simply Wall St’s 6 point value framework, Brinker International scores a full 6 out of 6. The sections that follow will walk through the key valuation methods behind that score, then conclude with a more complete way to think about what the stock could be worth.
Approach 1: Brinker International Discounted Cash Flow (DCF) Analysis
A Discounted Cash Flow, or DCF, model estimates what a company could be worth by projecting its future cash flows and discounting them back to today to reflect risk and the time value of money.
For Brinker International, the model uses a 2 Stage Free Cash Flow to Equity approach based on cash flows in $. The latest twelve month free cash flow is about $498.3 million. Analysts provide explicit forecasts out to 2027, with free cash flow of $507.1 million in that year, and Simply Wall St then extrapolates this path further using its own growth assumptions.
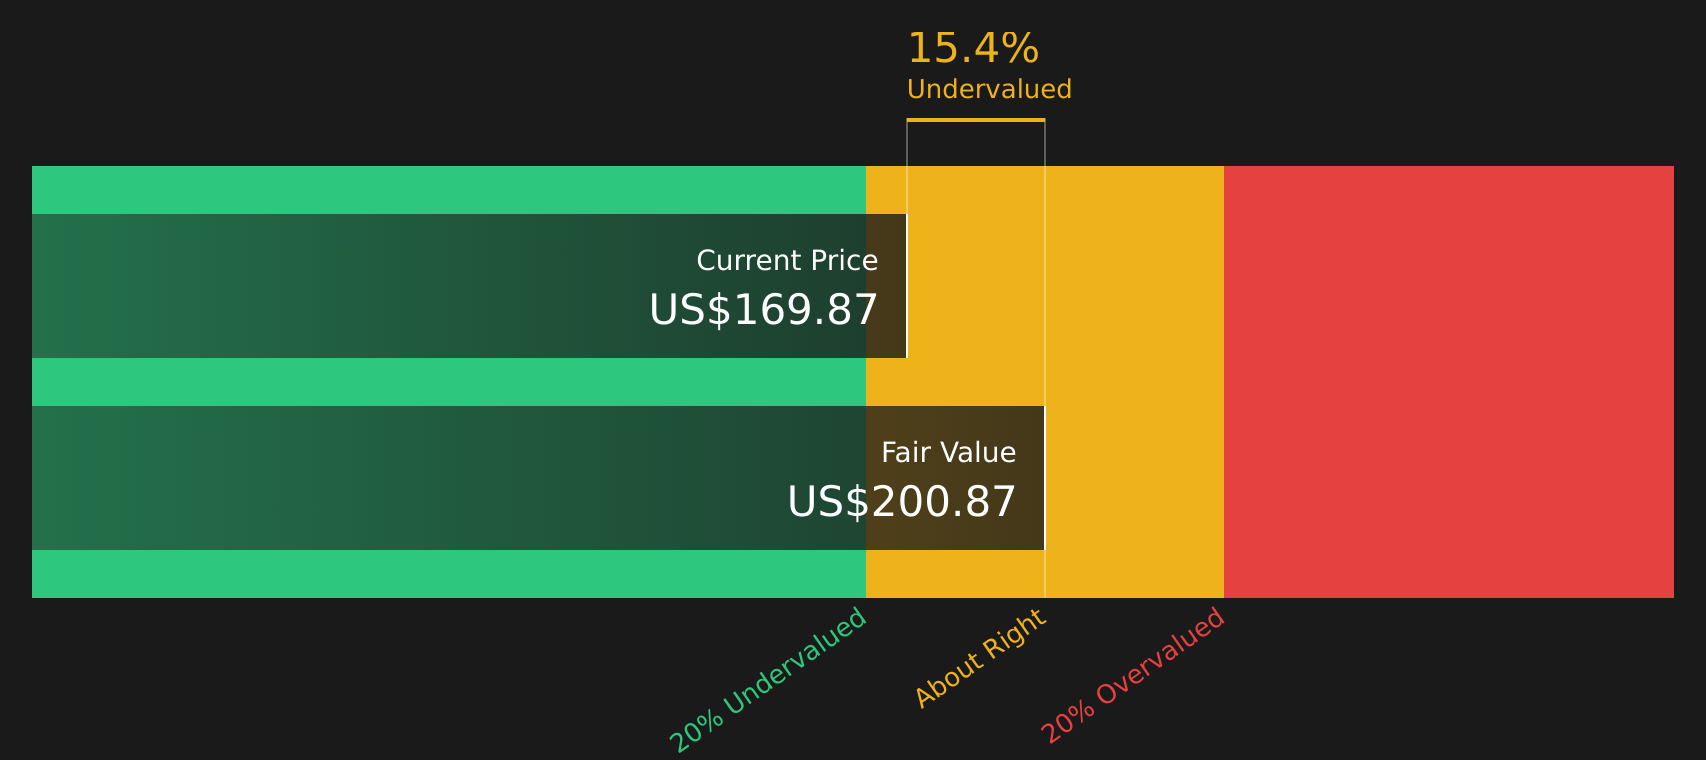
Those projections run out to 2035, with estimated free cash flow of $633.6 million in year ten, all discounted back to today using the model’s required return. Summing the discounted cash flows produces an estimated intrinsic value of about $201 per share.
Against a share price of roughly $152, the DCF output points to Brinker International trading at a 24.3% discount, which suggests the shares are currently priced below this cash flow based estimate of value.
Result: UNDERVALUED
Our Discounted Cash Flow (DCF) analysis suggests Brinker International is undervalued by 24.3%. Track this in your watchlist or portfolio, or discover 51 more high quality undervalued stocks.
Approach 2: Brinker International Price vs Earnings
For profitable companies, the P/E ratio is a useful way to relate what you are paying for each share to the earnings that business is currently generating. It is a quick way to see how much the market is willing to pay for each dollar of profit.
What counts as a normal or fair P/E depends on how the market views a company’s growth potential and risk. Higher expected growth or lower perceived risk can support a higher multiple, while lower growth expectations or higher risk tend to line up with a lower P/E.
Brinker International currently trades on a P/E of 14.3x. This sits below the Hospitality industry average of 21.6x and well below the 62.0x peer group average. Simply Wall St’s Fair Ratio for Brinker International is 20.0x, which reflects a P/E that might be expected given its earnings growth profile, industry, profit margins, market cap and risk factors.
This Fair Ratio is more tailored than a simple peer or industry comparison because it adjusts for the company’s own characteristics rather than assuming all Hospitality stocks deserve the same multiple. Comparing 14.3x to the 20.0x Fair Ratio points to Brinker International trading below this Fair Ratio based estimate.
Result: UNDERVALUED

P/E ratios tell one story, but what if the real opportunity lies elsewhere? Start investing in legacies, not executives. Discover our 18 top founder-led companies.
Upgrade Your Decision Making: Choose your Brinker International Narrative
Earlier it was noted that there is an even better way to understand valuation, so Narratives are worth introducing as a simple way for you to link your view of Brinker International’s story to a set of revenue, earnings and margin assumptions, then to a fair value that can be compared to the current share price.
On Simply Wall St’s Community page, Narratives let you turn this story into numbers by setting your own expectations. For example, one investor might align with the higher fair value near US$210 and build a scenario around Chili’s “flywheel” and remodel program. Another investor might lean toward the lower end near US$145 and focus on rising labor costs, changing consumer tastes and pressure on future P/E multiples.
Each Narrative sits on the platform as a live, easy to read forecast that updates when new earnings, guidance or news arrive. This allows you to quickly see whether your fair value still supports holding, adding or trimming Brinker International as the gap between your Fair Value and the latest Price narrows or widens over time.
Do you think there's more to the story for Brinker International? Head over to our Community to see what others are saying!

This article by Simply Wall St is general in nature. We provide commentary based on historical data and analyst forecasts only using an unbiased methodology and our articles are not intended to be financial advice. It does not constitute a recommendation to buy or sell any stock, and does not take account of your objectives, or your financial situation. We aim to bring you long-term focused analysis driven by fundamental data. Note that our analysis may not factor in the latest price-sensitive company announcements or qualitative material. Simply Wall St has no position in any stocks mentioned.
Have feedback on this article? Concerned about the content? Get in touch with us directly. Alternatively, email editorial-team@simplywallst.com
Contact Us
Contact Number :+852 3852 8500Webull Securities Limited is licensed with the Securities and Futures Commission of Hong Kong (CE No. BNG700) for carrying out Type 1 License for Dealing in Securities, Type 2 License for Dealing in Futures Contracts and Type 4 License for Advising on Securities.

English