
Has The Helix Energy Solutions Group (HLX) Rally Left Limited Upside For Investors?
- Evaluating whether Helix Energy Solutions Group at around US$10.14 offers good value, or whether the easy gains are behind it, starts with understanding how the current price lines up against its fundamentals.
- The stock has returned 2.9% over the past week, 3.6% over the past month, 58.4% year to date and 50.9% over the last year, which naturally raises questions about how much of the story is already reflected in the share price.
- Recent coverage has focused on Helix Energy Solutions Group as an offshore energy services company that is closely tied to activity levels in subsea well intervention and related services. This helps explain why investors pay attention when sentiment around offshore work changes. These news themes give useful context for the recent share price performance, because they highlight how expectations about future project work and contract wins can influence what investors are willing to pay today.
- Simply Wall St currently gives Helix Energy Solutions Group a valuation score of 2 out of 6, based on how often the stock looks undervalued across different checks. The rest of this article will walk through those valuation methods and finish by looking at a broader way to think about what the market might be pricing in.
Helix Energy Solutions Group scores just 2/6 on our valuation checks. See what other red flags we found in the full valuation breakdown.
Approach 1: Helix Energy Solutions Group Discounted Cash Flow (DCF) Analysis
A Discounted Cash Flow, or DCF, model estimates what a stock could be worth by projecting the company’s future cash flows and discounting them back to today’s value. It focuses on cash that might ultimately be available to shareholders, rather than reported earnings.
For Helix Energy Solutions Group, the model used is a 2 Stage Free Cash Flow to Equity approach. The company’s latest twelve month free cash flow sits at about $164 million. Analysts provide explicit free cash flow forecasts for the next few years, and Simply Wall St then extrapolates further out, with projected free cash flow of $124 million in 2030 and a series of estimates through to 2035, all in $.
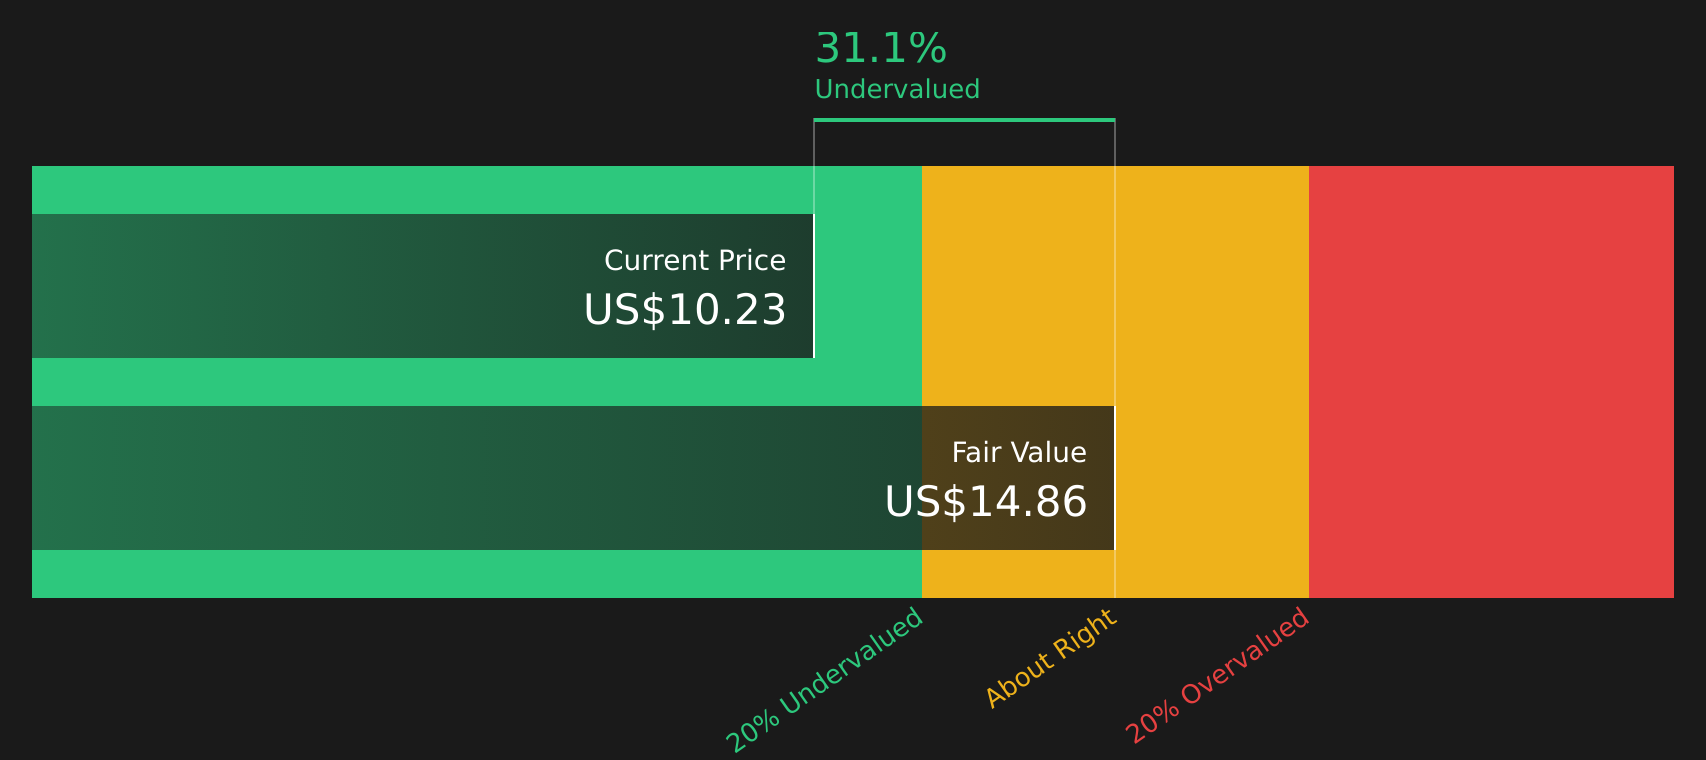
When those projected cash flows are discounted back to today using this model, the estimated intrinsic value comes out at about $14.85 per share. Against a current share price of roughly $10.14, this implies the stock trades at an estimated 31.7% discount, which indicates a potentially attractive valuation gap if the cash flow assumptions hold.
Result: UNDERVALUED
Our Discounted Cash Flow (DCF) analysis suggests Helix Energy Solutions Group is undervalued by 31.7%. Track this in your watchlist or portfolio, or discover 46 more high quality undervalued stocks.
Approach 2: Helix Energy Solutions Group Price vs Earnings
For profitable companies, the P/E ratio is a useful way to think about value because it compares what you pay for each share with the earnings that the company is currently generating. It effectively tells you how many years of current earnings the market is willing to pay for.
What counts as a “normal” P/E ratio depends on how investors view growth potential and risk. Higher expected growth or lower perceived risk can support a higher multiple, while slower growth or higher risk tends to justify a lower one.
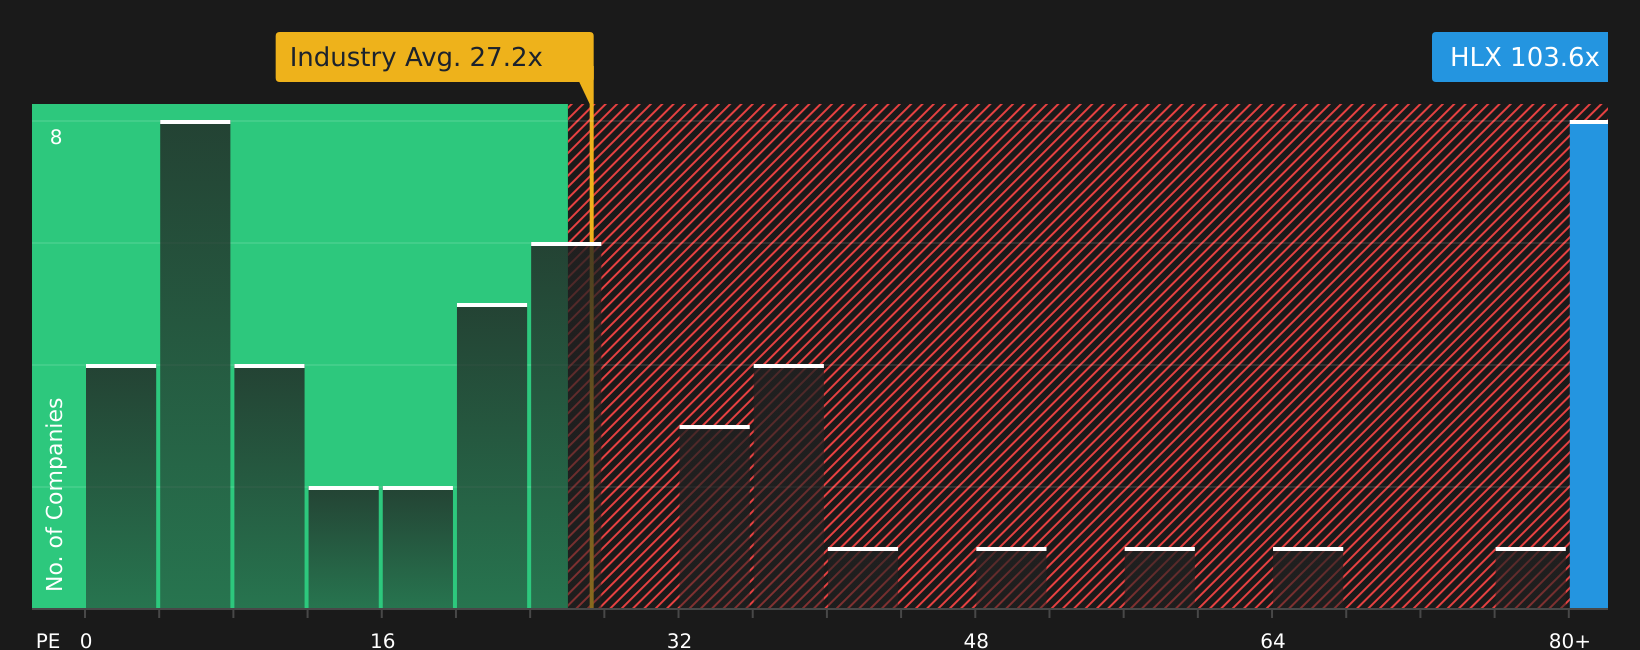
Helix Energy Solutions Group currently trades on a P/E of about 104.23x. That is above the Energy Services industry average of around 35.68x and also above the peer group average of roughly 76.55x. Simply Wall St’s Fair Ratio for the stock is 19.97x, which is a proprietary estimate of what the P/E might be based on factors like earnings growth, profit margins, industry, market cap and company specific risks.
This Fair Ratio can be more tailored than a simple comparison with peers or the wider industry because it explicitly factors in company fundamentals and risk profile. Compared with the current P/E of 104.23x, the Fair Ratio of 19.97x points to the stock trading well above this implied fair level.
Result: OVERVALUED
P/E ratios tell one story, but what if the real opportunity lies elsewhere? Start investing in legacies, not executives. Discover our 20 top founder-led companies.
Upgrade Your Decision Making: Choose your Helix Energy Solutions Group Narrative
Earlier it was mentioned that there is an even better way to understand valuation. Narratives are introduced here as the simple story you tell about Helix Energy Solutions Group, turning your view on its future revenue, earnings and margins into a financial forecast that links through to a fair value. You can then compare this with the current share price to decide whether the stock looks appealing or stretched, all within an easy to use tool on Simply Wall St's Community page that updates automatically when new news or earnings arrive. It can capture very different perspectives, such as one investor setting a fair value around the more optimistic US$14.0 scenario and another leaning toward the more cautious US$8.0 view, depending on which assumptions feel more realistic to you.
For Helix Energy Solutions Group however we will make it really easy for you with previews of two leading Helix Energy Solutions Group Narratives:
Start with the bullish case, which leans closer to the higher analyst targets and assumes the market is still underappreciating Helix's cash flow potential and contract visibility.
🐂 Helix Energy Solutions Group Bull Case
Fair value in this narrative: US$14.00 per share.
Implied undervaluation vs the recent US$10.14 share price: about 27.6% below that fair value anchor.
Revenue growth assumption: 3.50% a year.
- Views multi year contracts, decommissioning work and 2026 guidance as support for more dependable free cash flow and a higher long term earnings base.
- Sees robotics and renewables work, including trenching and offshore wind activity, steadily increasing the share of revenue coming from potentially higher margin, recurring style work.
- Accepts real risks around fossil fuel demand, regulation, client concentration, capital intensity and labour costs, but treats these as manageable within a positive long term cash flow outlook.
Now contrast that with a more cautious stance, which takes the view that Helix Energy Solutions Group is closer to fairly priced or even ahead of itself based on current expectations.
🐻 Helix Energy Solutions Group Bear Case
Fair value in this narrative: US$9.75 per share.
Implied overvaluation vs the recent US$10.14 share price: about 4.0% above that fair value anchor.
Revenue growth assumption: 3.06% a year.
- Treats the consensus price target and fair value of US$9.75 as a reasonable middle ground, with limited room for upside if contract awards, decommissioning work or robotics utilization fall short of expectations.
- Emphasizes execution and timing risks, including project deferrals, exposure to spot markets, higher operating costs and the impact of dry dock and maintenance cycles on free cash flow.
- Highlights that even with modest revenue growth and higher margins, returns for shareholders depend heavily on how consistently Helix converts its backlog into earnings and how disciplined future capital spending and buybacks turn out to be.
Do you think there's more to the story for Helix Energy Solutions Group? Head over to our Community to see what others are saying!

This article by Simply Wall St is general in nature. We provide commentary based on historical data and analyst forecasts only using an unbiased methodology and our articles are not intended to be financial advice. It does not constitute a recommendation to buy or sell any stock, and does not take account of your objectives, or your financial situation. We aim to bring you long-term focused analysis driven by fundamental data. Note that our analysis may not factor in the latest price-sensitive company announcements or qualitative material. Simply Wall St has no position in any stocks mentioned.
Have feedback on this article? Concerned about the content? Get in touch with us directly. Alternatively, email editorial-team@simplywallst.com
Contact Us
Contact Number :+852 3852 8500Webull Securities Limited is licensed with the Securities and Futures Commission of Hong Kong (CE No. BNG700) for carrying out Type 1 License for Dealing in Securities, Type 2 License for Dealing in Futures Contracts and Type 4 License for Advising on Securities.

English