
Helix Energy Solutions Group (HLX) Valuation Check After Recent Double Digit Share Price Gains
Why Helix Energy Solutions Group (HLX) is on investors’ radar
Helix Energy Solutions Group (HLX) has attracted fresh attention after its recent share performance, with the stock showing double digit returns over the past month and past 3 months.
Those moves come alongside reported annual revenue of US$1,301.4 million and net income of US$14.3 million. These figures give investors concrete reference points when weighing the company’s offshore energy services footprint.
See our latest analysis for Helix Energy Solutions Group.
At a share price of US$10.47, Helix’s recent momentum has been strong, with a 14.3% 30 day share price return and a 63.6% year to date share price return, alongside a 61.8% 1 year total shareholder return.
If you are looking beyond Helix and want to see what else is moving in energy related infrastructure, it may be worth scanning 35 power grid technology and infrastructure stocks
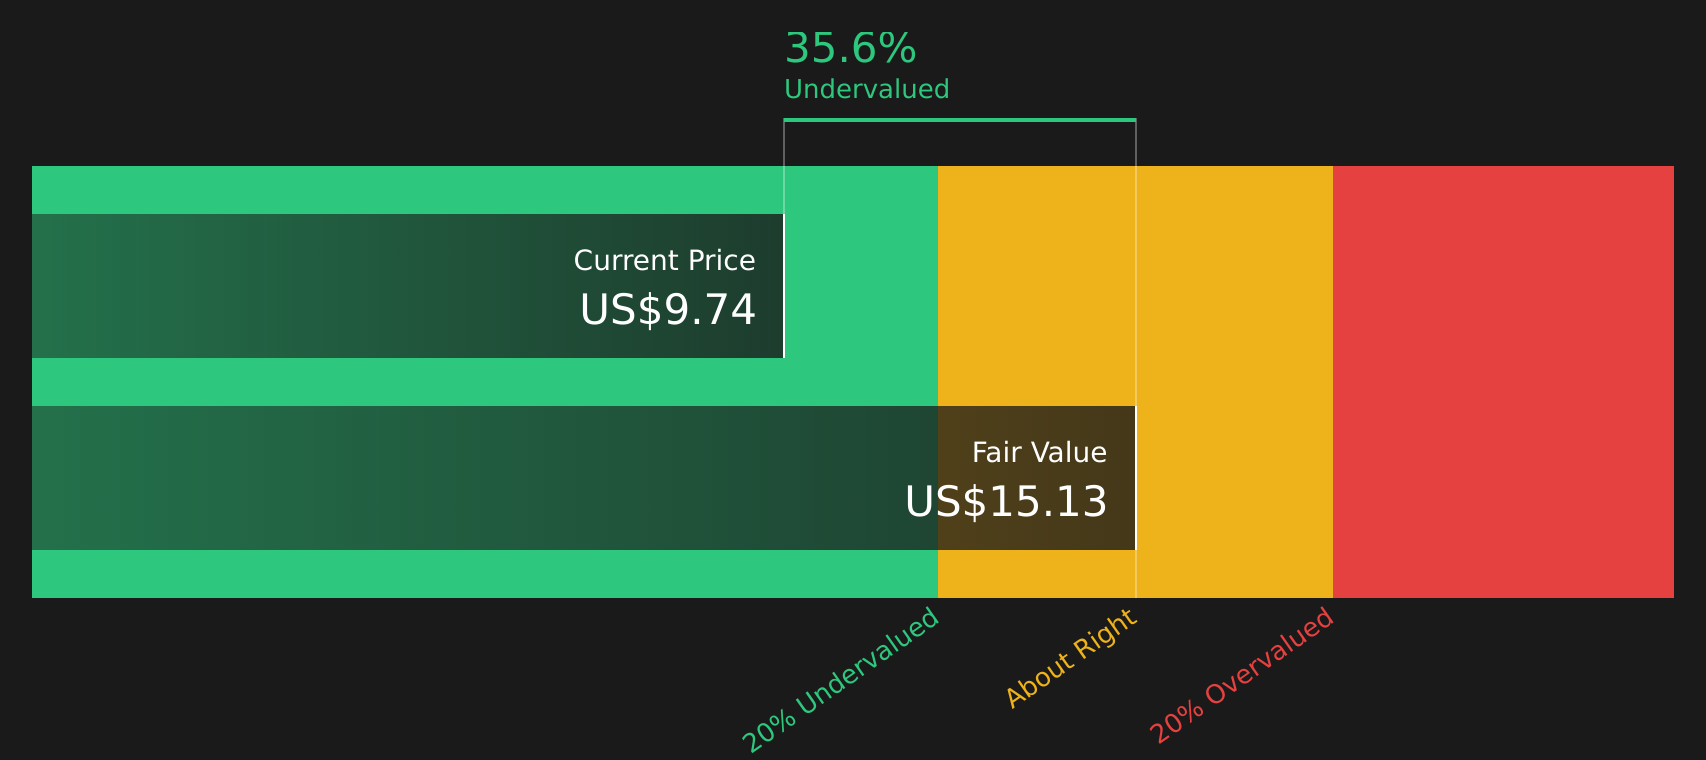
With Helix posting recent double digit returns and trading at a discount to both a US$12.50 price target and an estimated intrinsic value, you have to ask: is this a buying opportunity, or is the market already pricing in future growth?
Most Popular Narrative: 7.4% Overvalued
Helix Energy Solutions Group’s most followed valuation narrative puts fair value at $9.75 per share, which sits below the recent $10.47 close, creating a tension between market price and modelled worth.
The analysts have a consensus price target of $10.125 for Helix Energy Solutions Group based on their expectations of its future earnings growth, profit margins and other risk factors. However, there is a degree of disagreement amongst analysts, with the most bullish reporting a price target of $11.0, and the most bearish reporting a price target of just $9.0.
Curious what has to happen to earnings, margins, and the future profit multiple for that fair value to stack up? The core assumptions link moderate revenue expansion, a marked lift in profitability, and a valuation multiple that leans above the wider energy services group. The full narrative explains how those moving parts connect and where the biggest swing factors sit.
Result: Fair Value of $9.75 (OVERVALUED)
Have a read of the narrative in full and understand what's behind the forecasts.
However, there are still clear risks. These include project deferrals that hit vessel utilization and exposure to volatile spot markets that could pressure margins and cash generation.
Find out about the key risks to this Helix Energy Solutions Group narrative.
Another View: Cash Flows Point in a Different Direction
While the narrative driven model lands on a fair value of $9.75 and labels Helix as 7.4% overvalued, the SWS DCF model tells a different story, with an estimated future cash flow value of $14.85 per share and the stock trading at $10.05, suggesting a sizeable gap. Which lens do you trust more when cash flows and earnings based assumptions disagree?
Look into how the SWS DCF model arrives at its fair value.
Simply Wall St performs a discounted cash flow (DCF) on every stock in the world every day (check out Helix Energy Solutions Group for example). We show the entire calculation in full. You can track the result in your watchlist or portfolio and be alerted when this changes, or use our stock screener to discover 51 high quality undervalued stocks. If you save a screener we even alert you when new companies match - so you never miss a potential opportunity.
Next Steps
The signals around Helix may appear mixed, which is why it can help to review the underlying data yourself and act promptly while information is fresh so you can weigh up 2 key rewards and 2 important warning signs
Looking for more investment ideas?
If you stop at a single stock, you could miss other opportunities that better fit your goals, risk comfort, and income needs. Put a few minutes into widening your net with focused stock ideas that match how you like to invest.
- Target strong cash generation by reviewing companies in the solid balance sheet and fundamentals stocks screener (45 results) and identify businesses that combine resilient finances with room for growth.
- Search for potential value opportunities with the 51 high quality undervalued stocks and compare how their fundamentals line up with your own expectations.
- Build your watchlist with income focused ideas using the 12 dividend fortresses and avoid missing stocks that currently offer higher yields.
This article by Simply Wall St is general in nature. We provide commentary based on historical data and analyst forecasts only using an unbiased methodology and our articles are not intended to be financial advice. It does not constitute a recommendation to buy or sell any stock, and does not take account of your objectives, or your financial situation. We aim to bring you long-term focused analysis driven by fundamental data. Note that our analysis may not factor in the latest price-sensitive company announcements or qualitative material. Simply Wall St has no position in any stocks mentioned.
Have feedback on this article? Concerned about the content? Get in touch with us directly. Alternatively, email editorial-team@simplywallst.com
Contact Us
Contact Number :+852 3852 8500Webull Securities Limited is licensed with the Securities and Futures Commission of Hong Kong (CE No. BNG700) for carrying out Type 1 License for Dealing in Securities, Type 2 License for Dealing in Futures Contracts and Type 4 License for Advising on Securities.

English