
Is It Too Late To Consider Helix Energy Solutions Group (HLX) After A 52% YTD Rally?
- Wondering if Helix Energy Solutions Group at around US$9.72 is still offering value or if most of the opportunity is already priced in? This article breaks down what that current share price could mean for you.
- The stock is up 51.9% year to date and 44.9% over the past year, although it has fallen 3.9% in the last week and 5.5% over the past month, which may signal shifting sentiment around risk and reward.
- Recent coverage has focused on Helix Energy Solutions Group within the wider energy services space, highlighting how specialist offshore and subsea operators are reacting to contract activity, project pipelines and capital discipline across the sector. This backdrop helps frame why investors are reassessing the stock after a strong year to date move, alongside shorter term pullbacks.
- On Simply Wall St's valuation framework the company currently records a value score of 2 out of 6. This means only some of the standard checks point to potential undervaluation. The next sections will compare different valuation approaches before finishing with a broader way to judge whether that score tells the full story.
Helix Energy Solutions Group scores just 2/6 on our valuation checks. See what other red flags we found in the full valuation breakdown.
Approach 1: Helix Energy Solutions Group Discounted Cash Flow (DCF) Analysis
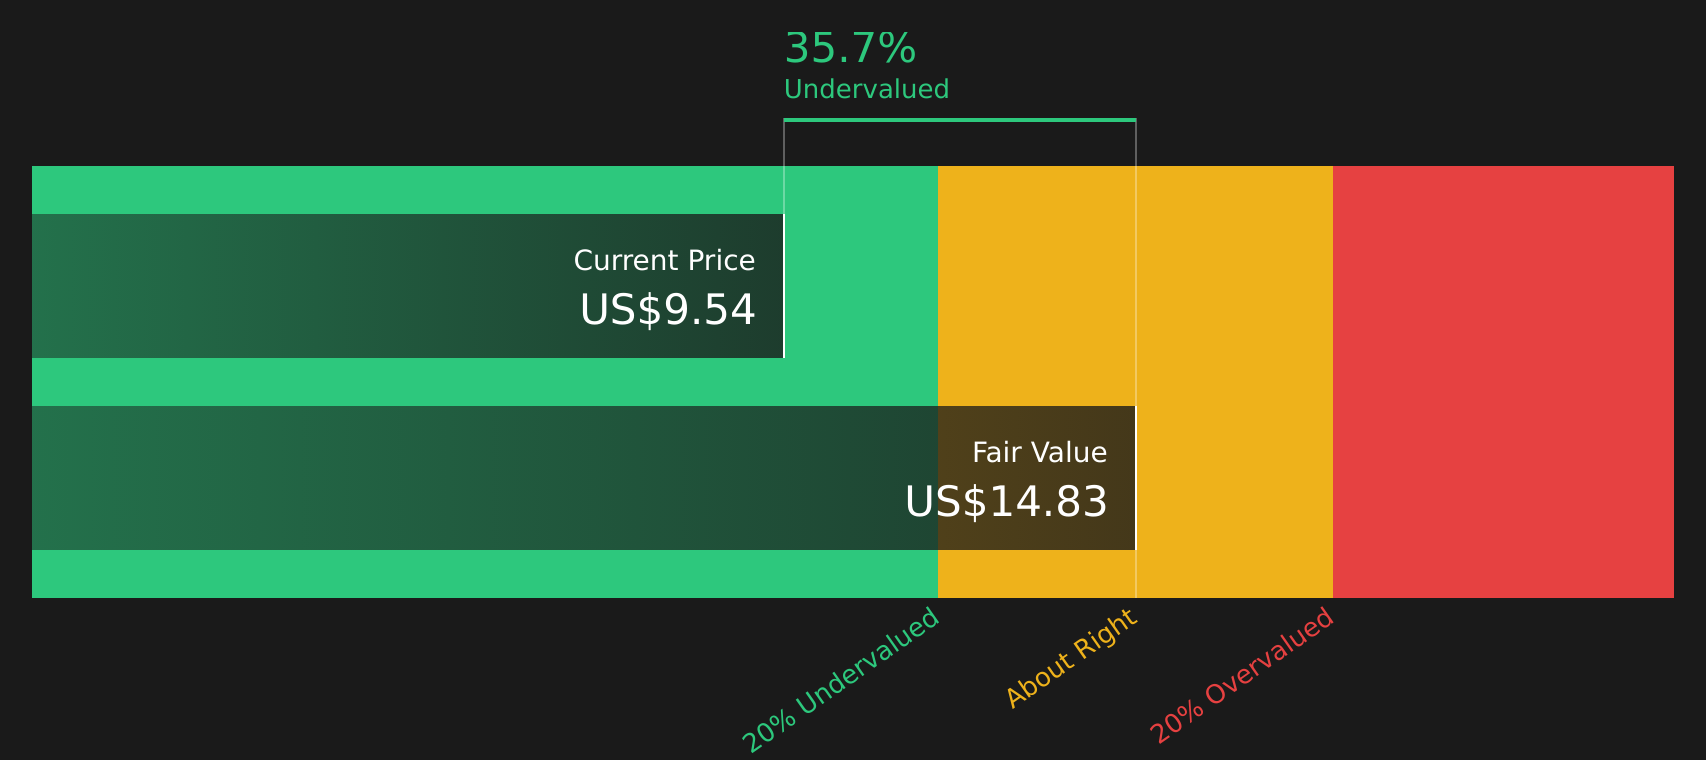
A Discounted Cash Flow, or DCF, model estimates what a stock could be worth by projecting future cash flows, then discounting those cash flows back to today to reflect time and risk. For Helix Energy Solutions Group, the model used is a 2 Stage Free Cash Flow to Equity approach that focuses on cash available to shareholders.
Helix currently records last twelve month free cash flow of about $164 million. Analysts provide detailed cash flow estimates for several years, and Simply Wall St then extrapolates further out, including a projected free cash flow of $124 million in 2030. A series of annual projections from 2026 to 2035 is discounted back to today, all in dollar terms, to arrive at an estimated intrinsic value per share of $14.82.
Against a recent share price of about $9.72, this DCF output implies the stock trades at a 34.4% discount to that intrinsic value, which points to undervaluation on this specific cash flow based framework.
Result: UNDERVALUED
Our Discounted Cash Flow (DCF) analysis suggests Helix Energy Solutions Group is undervalued by 34.4%. Track this in your watchlist or portfolio, or discover 46 more high quality undervalued stocks.
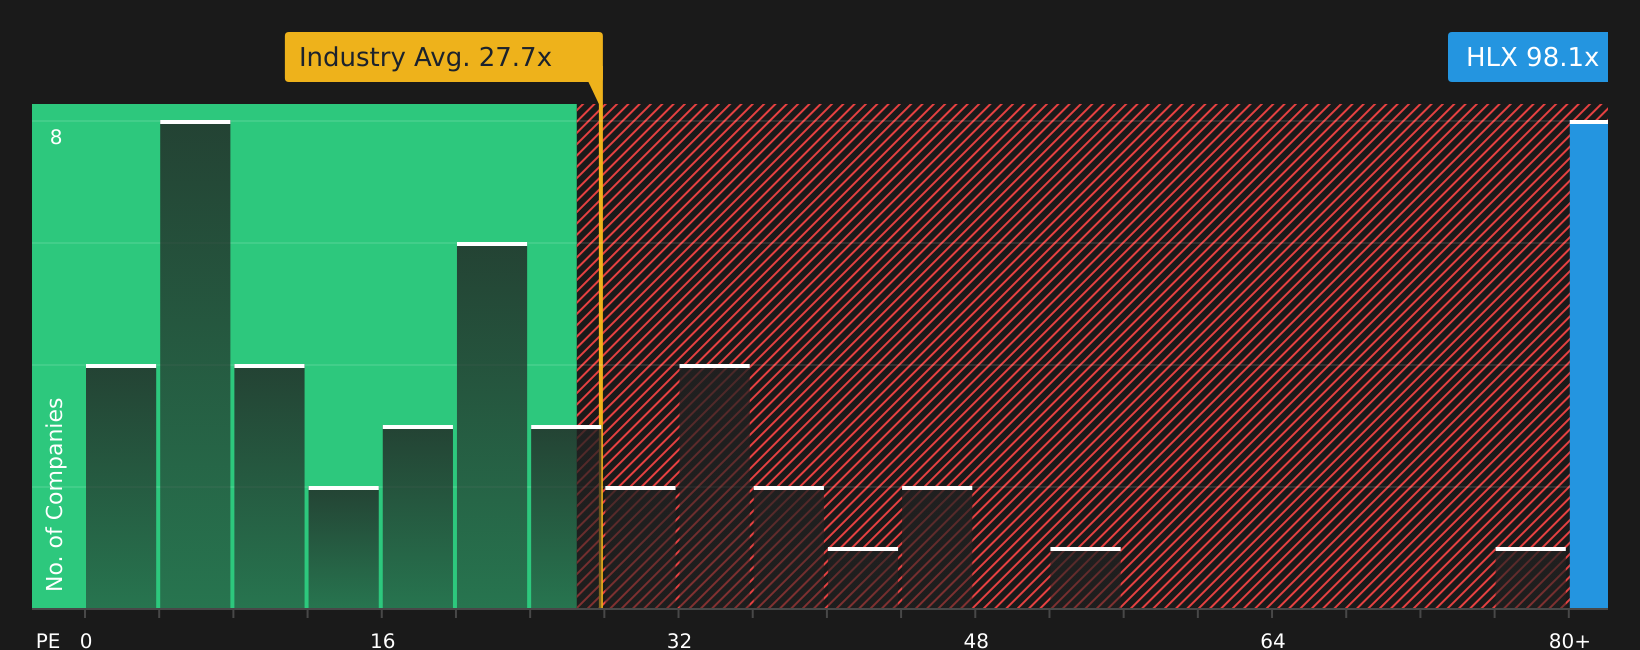
Approach 2: Helix Energy Solutions Group Price vs Earnings
For a profitable company, the P/E ratio is a straightforward way to think about value because it links what you pay for each share to the earnings that support that share. Higher growth expectations or lower perceived risk can justify a higher P/E, while slower growth or higher risk usually call for a lower, more cautious multiple.
Helix Energy Solutions Group currently trades on a P/E of about 99.9x. That sits above the Energy Services industry average P/E of 26.8x and the peer average of 77.4x, so on simple comparisons the stock screens as more expensive than many sector peers.
Simply Wall St’s Fair Ratio for Helix is 17.9x. This is a proprietary estimate of what the P/E could reasonably be, given factors such as the company’s earnings profile, industry, profit margins, market cap and key risks. Because it adjusts for these company specific drivers, the Fair Ratio can be more informative than a plain comparison with industry or peer averages. Setting this 17.9x Fair Ratio against the current 99.9x P/E suggests the stock is trading above what this framework would consider a fair earnings multiple.
Result: OVERVALUED
P/E ratios tell one story, but what if the real opportunity lies elsewhere? Start investing in legacies, not executives. Discover our 20 top founder-led companies.
Upgrade Your Decision Making: Choose your Helix Energy Solutions Group Narrative
Earlier it was mentioned that there is an even better way to understand valuation. Meet Narratives, a simple tool on Simply Wall St’s Community page that lets you link your view of Helix Energy Solutions Group’s story to a set of revenue, earnings and margin forecasts. You can then compare the Fair Value that comes from that story with today’s price to help decide whether to act, and see that Fair Value update automatically as new news or earnings arrive. For example, a bullish Helix investor who accepts a US$14.00 fair value and expects revenue of about US$1.4b, earnings of US$89.5 million and a P/E of 29.2x in 2029 is effectively running a different Narrative from a more cautious investor who anchors on a US$8.00 fair value with similar revenue and earnings but a 15.3x P/E. Narratives makes those different views transparent, comparable and easy to track over time.
For Helix Energy Solutions Group, here are previews of two leading Helix Energy Solutions Group Narratives to make comparison easier:
🐂 Helix Energy Solutions Group Bull Case
Fair value: US$9.75 per share
Implied discount vs recent price of US$9.72: about 0.3% below this fair value snapshot
Revenue growth assumption: 3.06% a year
- Analysts highlight a steady contract backlog, including multiyear work and decommissioning agreements, as a support for revenue visibility and margins.
- Growth in robotics and renewables related services is expected to broaden the revenue mix and support higher profitability over time.
- The bull view emphasizes rising demand for well abandonment and offshore maintenance, plus share repurchases and guidance out to 2025, to frame a constructive stance on earnings and valuation.
🐻 Helix Energy Solutions Group Bear Case
Fair value: US$8.00 per share
Implied premium vs recent price of US$9.72: about 21.5% above this fair value snapshot
Revenue growth assumption: 3.29% a year
- Bearish analysts focus on project delays, permitting issues and regulatory uncertainty that could keep margins under pressure despite a solid backlog.
- High fixed costs, exposure to spot markets and labor cost inflation are viewed as key sources of earnings volatility and free cash flow pressure.
- This view treats the one time 2026 item and ongoing market uncertainty as reasons to question how much confidence to place in the earnings path that current pricing implies.
Together, these Narratives provide both a bullish and a more cautious reference point. The next step is to decide which set of assumptions is closer to your own view of Helix Energy Solutions Group, and how much price risk you are comfortable taking on either side of that fair value range while you monitor new contracts, guidance updates and industry conditions.
To see how these results tie into long-term growth, risks, and valuation, check out the full range of community narratives for Helix Energy Solutions Group on Simply Wall St. Add the company to your watchlist or portfolio so you'll be alerted when the story evolves.
Do you think there's more to the story for Helix Energy Solutions Group? Head over to our Community to see what others are saying!

This article by Simply Wall St is general in nature. We provide commentary based on historical data and analyst forecasts only using an unbiased methodology and our articles are not intended to be financial advice. It does not constitute a recommendation to buy or sell any stock, and does not take account of your objectives, or your financial situation. We aim to bring you long-term focused analysis driven by fundamental data. Note that our analysis may not factor in the latest price-sensitive company announcements or qualitative material. Simply Wall St has no position in any stocks mentioned.
Have feedback on this article? Concerned about the content? Get in touch with us directly. Alternatively, email editorial-team@simplywallst.com
Contact Us
Contact Number :+852 3852 8500Webull Securities Limited is licensed with the Securities and Futures Commission of Hong Kong (CE No. BNG700) for carrying out Type 1 License for Dealing in Securities, Type 2 License for Dealing in Futures Contracts and Type 4 License for Advising on Securities.

English