3 Asian Stocks Possibly Trading At Discounts Of Up To 42.9%
Amidst a backdrop of global economic uncertainties and fluctuating trade policies, Asian markets have been navigating through a complex landscape that has seen mixed performances across various indices. In this environment, identifying undervalued stocks can be particularly appealing to investors seeking potential opportunities; these stocks may offer value by trading below their intrinsic worth due to market mispricing or overlooked growth prospects.
Top 10 Undervalued Stocks Based On Cash Flows In Asia
| Name | Current Price | Fair Value (Est) | Discount (Est) |
| Aidma Holdings (TSE:7373) | ¥1843.00 | ¥3675.49 | 49.9% |
| Shibaura Mechatronics (TSE:6590) | ¥6760.00 | ¥13268.26 | 49.1% |
| Sany Renewable EnergyLtd (SHSE:688349) | CN¥22.70 | CN¥44.88 | 49.4% |
| RACCOON HOLDINGS (TSE:3031) | ¥798.00 | ¥1576.52 | 49.4% |
| Jiangshan Oupai Door Industry (SHSE:603208) | CN¥14.06 | CN¥27.62 | 49.1% |
| Rakus (TSE:3923) | ¥2184.00 | ¥4288.17 | 49.1% |
| Wuxi Lead Intelligent EquipmentLTD (SZSE:300450) | CN¥19.92 | CN¥39.08 | 49% |
| Beijing Zhong Ke San Huan High-Tech (SZSE:000970) | CN¥10.50 | CN¥20.67 | 49.2% |
| HanJung Natural Connectivity System.co.Ltd (KOSDAQ:A107640) | ₩27400.00 | ₩54530.89 | 49.8% |
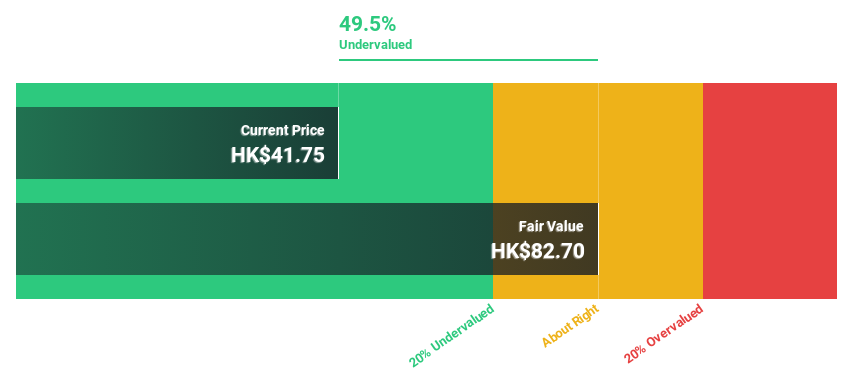
| ASMPT (SEHK:522) | HK$53.40 | HK$105.00 | 49.1% |
Let's dive into some prime choices out of the screener.
Zhejiang Leapmotor Technology (SEHK:9863)
Overview: Zhejiang Leapmotor Technology Co., Ltd. focuses on the research, development, production, and sale of new energy vehicles in Mainland China and internationally, with a market capitalization of HK$79.62 billion.
Operations: The company's revenue primarily stems from its production, research and development, and sales of new energy vehicles, amounting to CN¥32.16 billion.
Estimated Discount To Fair Value: 29.9%
Zhejiang Leapmotor Technology is currently trading at HK$59.55, significantly below its estimated fair value of HK$84.97, presenting a potential undervaluation based on cash flows. The company's revenue is forecast to grow by 27.3% annually, outpacing the Hong Kong market average of 8.6%. Despite reporting a net loss of CNY 2,820.8 million for 2024, this marks an improvement from the previous year's larger loss, indicating progress toward profitability within three years.
- Our expertly prepared growth report on Zhejiang Leapmotor Technology implies its future financial outlook may be stronger than recent results.
- Click here and access our complete balance sheet health report to understand the dynamics of Zhejiang Leapmotor Technology.
Range Intelligent Computing Technology Group (SZSE:300442)
Overview: Range Intelligent Computing Technology Group Company Limited offers server hosting services to internet companies and large cloud vendors in China, with a market cap of CN¥83.61 billion.
Operations: The company generates revenue primarily through its IDC Services segment, which amounted to CN¥4.58 billion.
Estimated Discount To Fair Value: 42.9%
Range Intelligent Computing Technology Group, trading at CN¥48.57, is undervalued with a fair value estimate of CN¥85.13. Despite high debt levels and volatile share prices, its earnings are projected to grow 29.3% annually, surpassing the Chinese market average of 24.1%. Recent earnings showed a dip in net income to CN¥430.17 million for Q1 2025 from the previous year but included a robust buyback plan up to CN¥1 billion, enhancing shareholder value potential.
- Our comprehensive growth report raises the possibility that Range Intelligent Computing Technology Group is poised for substantial financial growth.
- Click here to discover the nuances of Range Intelligent Computing Technology Group with our detailed financial health report.

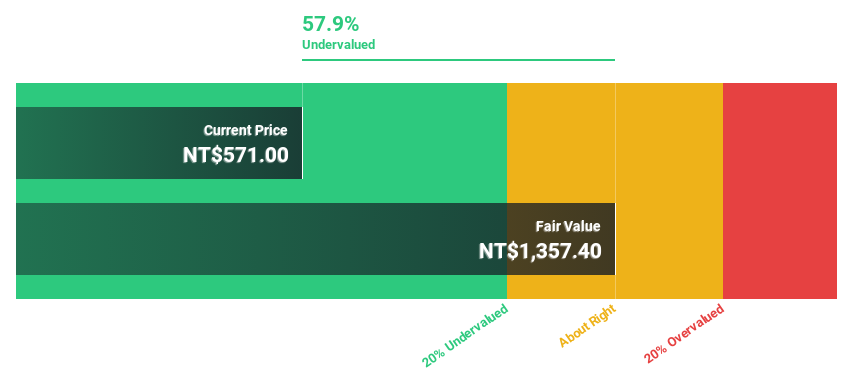
Elite Material (TWSE:2383)
Overview: Elite Material Co., Ltd. produces and sells copper clad laminates, electronic-industrial specialty chemicals, raw materials, and electronic components in Taiwan, China, and internationally with a market cap of NT$211.79 billion.
Operations: The company's revenue segments include copper clad laminates, electronic-industrial specialty chemicals and raw materials, and electronic components across Taiwan, China, and international markets.
Estimated Discount To Fair Value: 30%
Elite Material, trading at NT$611, is undervalued with a fair value estimate of NT$872.81. Recent Q1 2025 results showed sales rising to NT$21.68 billion from NT$12.9 billion the previous year, and net income increased to NT$3.47 billion from NT$1.98 billion, indicating strong cash flow support for its valuation. Despite share price volatility, earnings are forecasted to grow 17.18% annually, outpacing the Taiwan market's average growth rate of 14.1%.
- Upon reviewing our latest growth report, Elite Material's projected financial performance appears quite optimistic.
- Click to explore a detailed breakdown of our findings in Elite Material's balance sheet health report.
Make It Happen
- Navigate through the entire inventory of 264 Undervalued Asian Stocks Based On Cash Flows here.
- Shareholder in one or more of these companies? Ensure you're never caught off-guard by adding your portfolio in Simply Wall St for timely alerts on significant stock developments.
- Join a community of smart investors by using Simply Wall St. It's free and delivers expert-level analysis on worldwide markets.
Searching for a Fresh Perspective?
- Explore high-performing small cap companies that haven't yet garnered significant analyst attention.
- Diversify your portfolio with solid dividend payers offering reliable income streams to weather potential market turbulence.
- Fuel your portfolio with companies showing strong growth potential, backed by optimistic outlooks both from analysts and management.
This article by Simply Wall St is general in nature. We provide commentary based on historical data and analyst forecasts only using an unbiased methodology and our articles are not intended to be financial advice. It does not constitute a recommendation to buy or sell any stock, and does not take account of your objectives, or your financial situation. We aim to bring you long-term focused analysis driven by fundamental data. Note that our analysis may not factor in the latest price-sensitive company announcements or qualitative material. Simply Wall St has no position in any stocks mentioned.
Have feedback on this article? Concerned about the content? Get in touch with us directly. Alternatively, email editorial-team@simplywallst.com
① During the campaign period, US stocks, US stocks short selling, US stock options, Hong Kong stocks, and A-shares trading will maintain at $0 commission, and no subscription/redemption fees for mutual fund transactions. $0 fee offer has a time limit, until further notice. For more information, please visit: https://www.webull.hk/pricing
Webull Securities Limited is licensed with the Securities and Futures Commission of Hong Kong (CE No. BNG700) for carrying out Type 1 License for Dealing in Securities, Type 2 License for Dealing in Futures Contracts and Type 4 License for Advising on Securities.

English