Nextracker's (NASDAQ:NXT) Performance Is Even Better Than Its Earnings Suggest
Nextracker Inc. (NASDAQ:NXT) recently posted some strong earnings, and the market responded positively. We have done some analysis, and we found several positive factors beyond the profit numbers.
Examining Cashflow Against Nextracker's Earnings
Many investors haven't heard of the accrual ratio from cashflow, but it is actually a useful measure of how well a company's profit is backed up by free cash flow (FCF) during a given period. The accrual ratio subtracts the FCF from the profit for a given period, and divides the result by the average operating assets of the company over that time. You could think of the accrual ratio from cashflow as the 'non-FCF profit ratio'.
That means a negative accrual ratio is a good thing, because it shows that the company is bringing in more free cash flow than its profit would suggest. That is not intended to imply we should worry about a positive accrual ratio, but it's worth noting where the accrual ratio is rather high. That's because some academic studies have suggested that high accruals ratios tend to lead to lower profit or less profit growth.
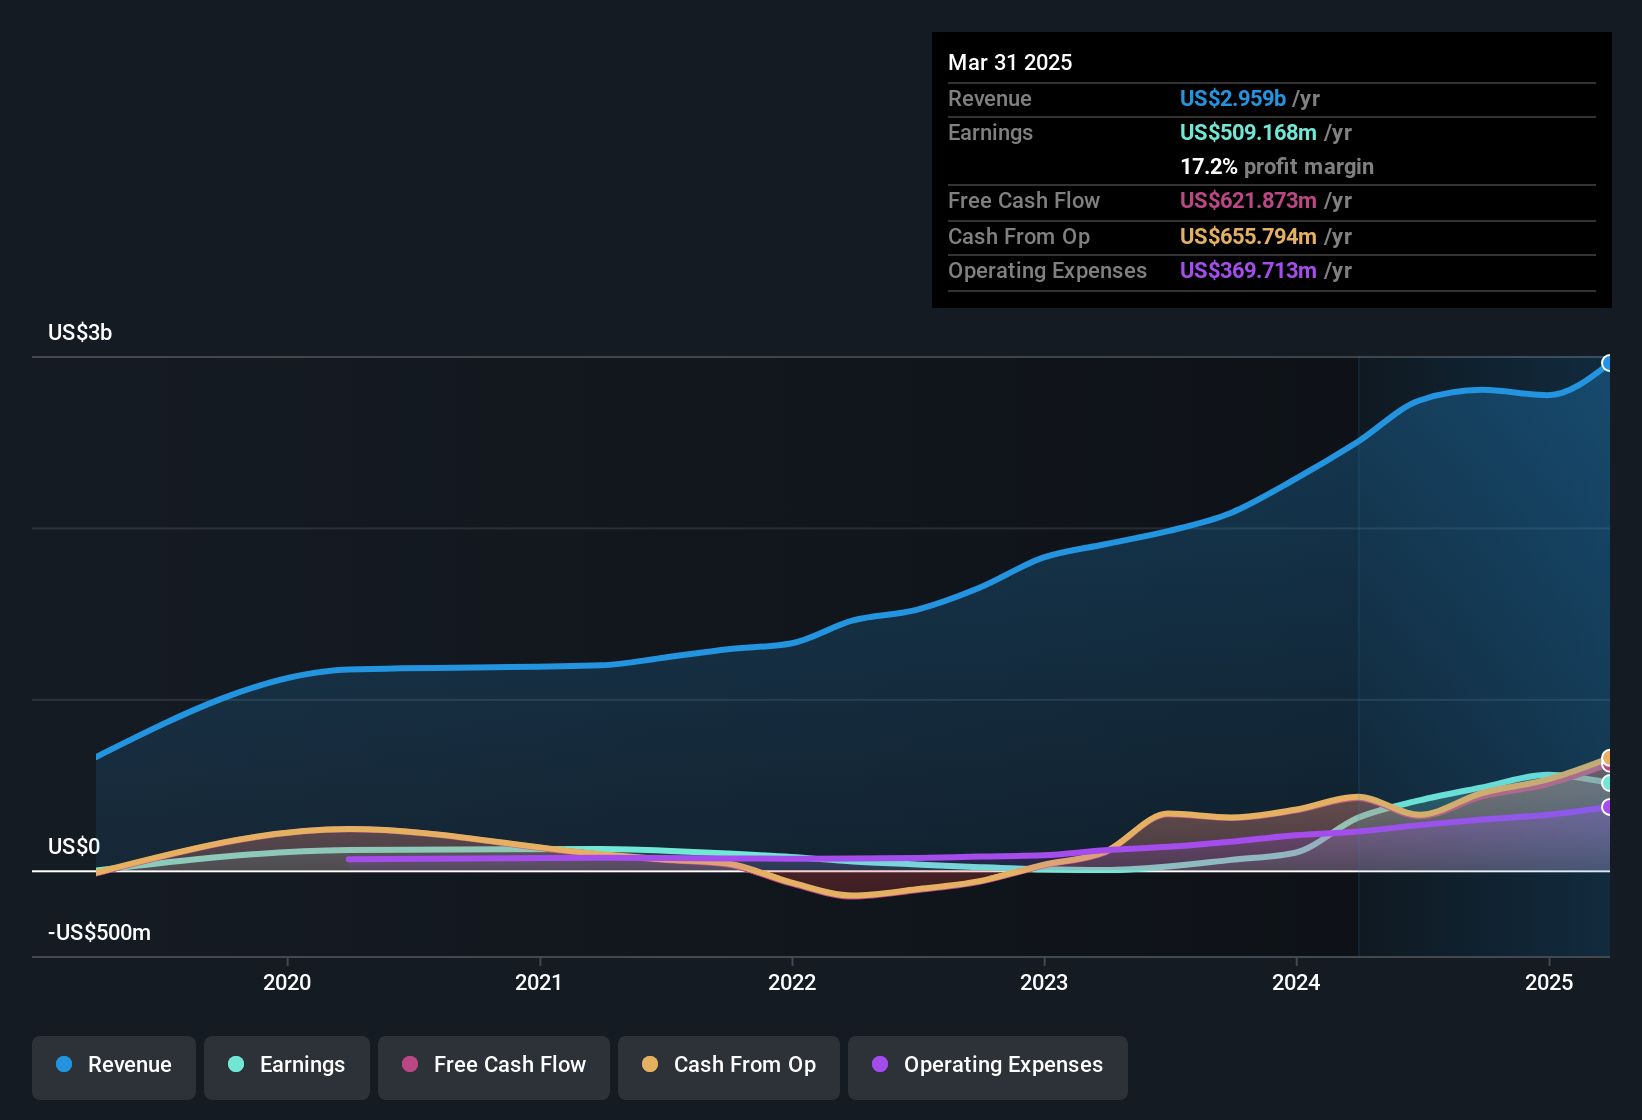
For the year to March 2025, Nextracker had an accrual ratio of -0.15. That indicates that its free cash flow quite significantly exceeded its statutory profit. To wit, it produced free cash flow of US$622m during the period, dwarfing its reported profit of US$509.2m. Nextracker shareholders are no doubt pleased that free cash flow improved over the last twelve months.
That might leave you wondering what analysts are forecasting in terms of future profitability. Luckily, you can click here to see an interactive graph depicting future profitability, based on their estimates.
Our Take On Nextracker's Profit Performance
Nextracker's accrual ratio is solid, and indicates strong free cash flow, as we discussed, above. Because of this, we think Nextracker's earnings potential is at least as good as it seems, and maybe even better! Unfortunately, though, its earnings per share actually fell back over the last year. At the end of the day, it's essential to consider more than just the factors above, if you want to understand the company properly. Obviously, we love to consider the historical data to inform our opinion of a company. But it can be really valuable to consider what other analysts are forecasting. So feel free to check out our free graph representing analyst forecasts.
Today we've zoomed in on a single data point to better understand the nature of Nextracker's profit. But there is always more to discover if you are capable of focussing your mind on minutiae. For example, many people consider a high return on equity as an indication of favorable business economics, while others like to 'follow the money' and search out stocks that insiders are buying. So you may wish to see this free collection of companies boasting high return on equity, or this list of stocks with high insider ownership.
Have feedback on this article? Concerned about the content? Get in touch with us directly. Alternatively, email editorial-team (at) simplywallst.com.
This article by Simply Wall St is general in nature. We provide commentary based on historical data and analyst forecasts only using an unbiased methodology and our articles are not intended to be financial advice. It does not constitute a recommendation to buy or sell any stock, and does not take account of your objectives, or your financial situation. We aim to bring you long-term focused analysis driven by fundamental data. Note that our analysis may not factor in the latest price-sensitive company announcements or qualitative material. Simply Wall St has no position in any stocks mentioned.
① During the campaign period, US stocks, US stocks short selling, US stock options, Hong Kong stocks, and A-shares trading will maintain at $0 commission, and no subscription/redemption fees for mutual fund transactions. $0 fee offer has a time limit, until further notice. For more information, please visit: https://www.webull.hk/pricing
Webull Securities Limited is licensed with the Securities and Futures Commission of Hong Kong (CE No. BNG700) for carrying out Type 1 License for Dealing in Securities, Type 2 License for Dealing in Futures Contracts and Type 4 License for Advising on Securities.

English