Strong week for Lifetime Brands (NASDAQ:LCUT) shareholders doesn't alleviate pain of three-year loss
This week we saw the Lifetime Brands, Inc. (NASDAQ:LCUT) share price climb by 20%. But that doesn't change the fact that the returns over the last three years have been disappointing. In that time, the share price dropped 66%. So it is really good to see an improvement. Perhaps the company has turned over a new leaf.
Although the past week has been more reassuring for shareholders, they're still in the red over the last three years, so let's see if the underlying business has been responsible for the decline.
Given that Lifetime Brands didn't make a profit in the last twelve months, we'll focus on revenue growth to form a quick view of its business development. When a company doesn't make profits, we'd generally hope to see good revenue growth. As you can imagine, fast revenue growth, when maintained, often leads to fast profit growth.
In the last three years Lifetime Brands saw its revenue shrink by 6.9% per year. That is not a good result. The share price decline of 18% compound, over three years, is understandable given the company doesn't have profits to boast of, and revenue is moving in the wrong direction. Having said that, if growth is coming in the future, now may be the low ebb for the company. We don't generally like to own companies that lose money and can't grow revenues. But any company is worth looking at when it makes a maiden profit.
The graphic below depicts how earnings and revenue have changed over time (unveil the exact values by clicking on the image).
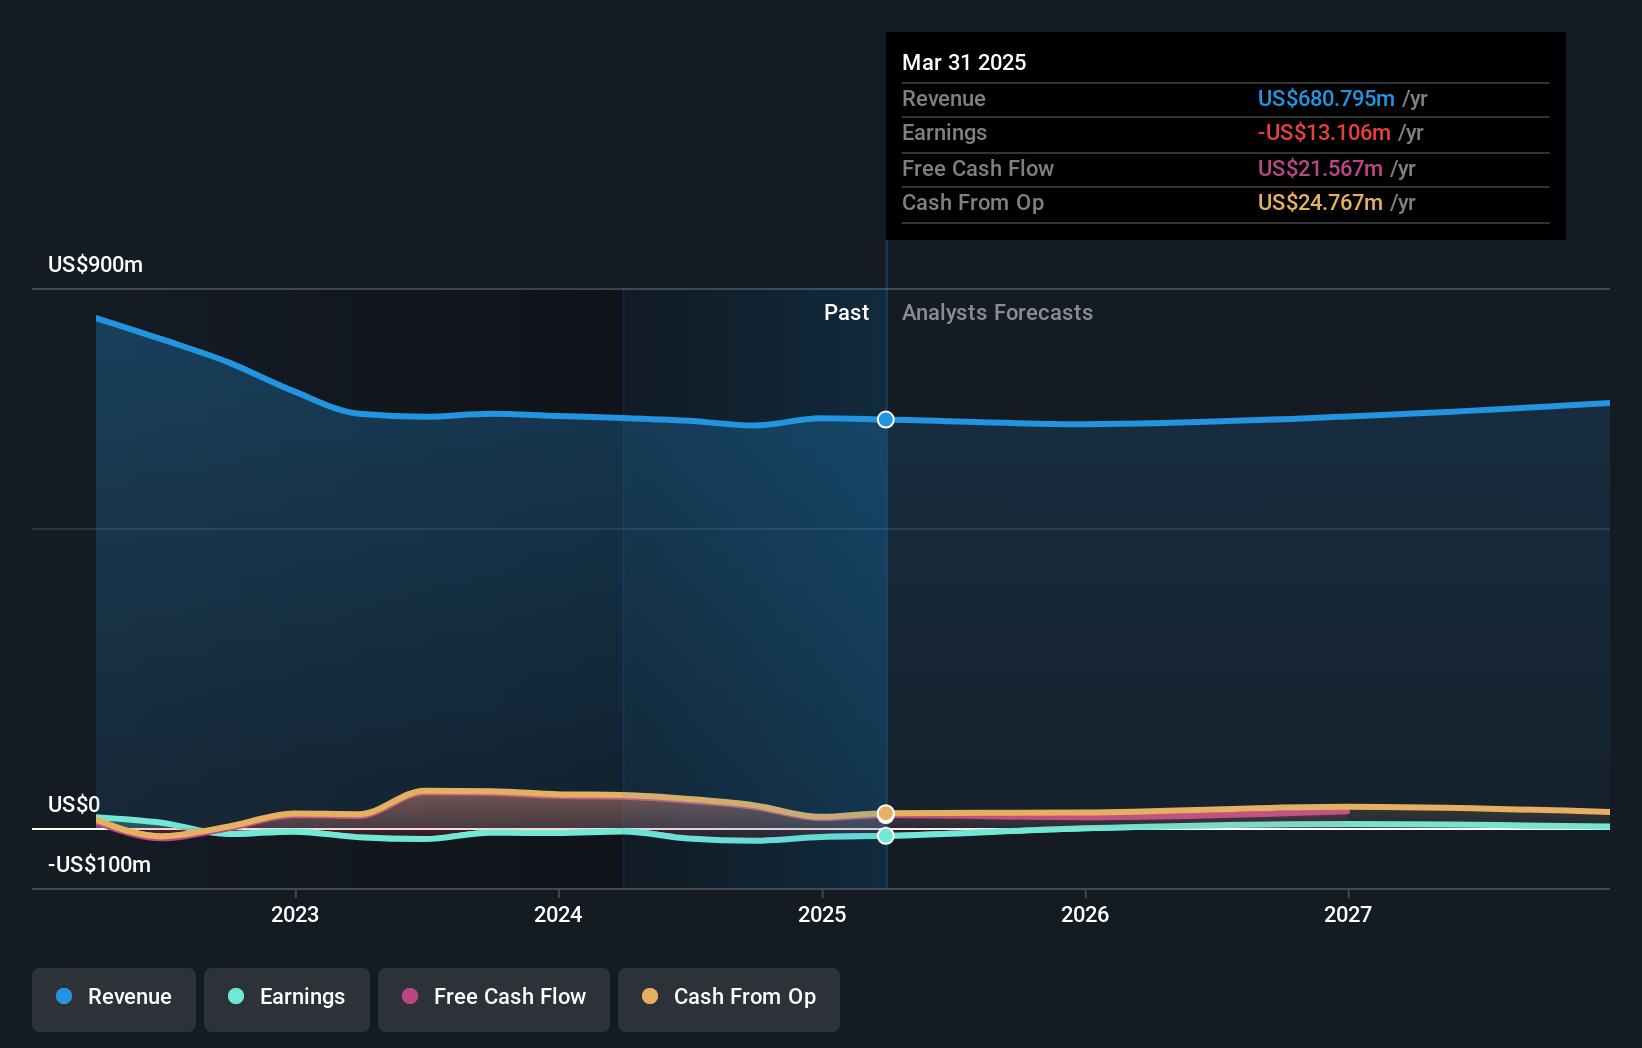
This free interactive report on Lifetime Brands' balance sheet strength is a great place to start, if you want to investigate the stock further.

What About Dividends?
As well as measuring the share price return, investors should also consider the total shareholder return (TSR). The TSR incorporates the value of any spin-offs or discounted capital raisings, along with any dividends, based on the assumption that the dividends are reinvested. It's fair to say that the TSR gives a more complete picture for stocks that pay a dividend. We note that for Lifetime Brands the TSR over the last 3 years was -63%, which is better than the share price return mentioned above. This is largely a result of its dividend payments!
A Different Perspective
While the broader market gained around 14% in the last year, Lifetime Brands shareholders lost 62% (even including dividends). Even the share prices of good stocks drop sometimes, but we want to see improvements in the fundamental metrics of a business, before getting too interested. Regrettably, last year's performance caps off a bad run, with the shareholders facing a total loss of 5% per year over five years. Generally speaking long term share price weakness can be a bad sign, though contrarian investors might want to research the stock in hope of a turnaround. I find it very interesting to look at share price over the long term as a proxy for business performance. But to truly gain insight, we need to consider other information, too. For example, we've discovered 2 warning signs for Lifetime Brands that you should be aware of before investing here.
If you are like me, then you will not want to miss this free list of undervalued small caps that insiders are buying.
Please note, the market returns quoted in this article reflect the market weighted average returns of stocks that currently trade on American exchanges.
Have feedback on this article? Concerned about the content? Get in touch with us directly. Alternatively, email editorial-team (at) simplywallst.com.
This article by Simply Wall St is general in nature. We provide commentary based on historical data and analyst forecasts only using an unbiased methodology and our articles are not intended to be financial advice. It does not constitute a recommendation to buy or sell any stock, and does not take account of your objectives, or your financial situation. We aim to bring you long-term focused analysis driven by fundamental data. Note that our analysis may not factor in the latest price-sensitive company announcements or qualitative material. Simply Wall St has no position in any stocks mentioned.
① During the campaign period, US stocks, US stocks short selling, US stock options, Hong Kong stocks, and A-shares trading will maintain at $0 commission, and no subscription/redemption fees for mutual fund transactions. $0 fee offer has a time limit, until further notice. For more information, please visit: https://www.webull.hk/pricing
Webull Securities Limited is licensed with the Securities and Futures Commission of Hong Kong (CE No. BNG700) for carrying out Type 1 License for Dealing in Securities, Type 2 License for Dealing in Futures Contracts and Type 4 License for Advising on Securities.

English