Exponent, Inc.'s (NASDAQ:EXPO) Stock Has Shown Weakness Lately But Financial Prospects Look Decent: Is The Market Wrong?
It is hard to get excited after looking at Exponent's (NASDAQ:EXPO) recent performance, when its stock has declined 6.9% over the past three months. However, stock prices are usually driven by a company’s financials over the long term, which in this case look pretty respectable. Specifically, we decided to study Exponent's ROE in this article.
Return on equity or ROE is an important factor to be considered by a shareholder because it tells them how effectively their capital is being reinvested. In simpler terms, it measures the profitability of a company in relation to shareholder's equity.
How To Calculate Return On Equity?
The formula for ROE is:
Return on Equity = Net Profit (from continuing operations) ÷ Shareholders' Equity
So, based on the above formula, the ROE for Exponent is:
24% = US$106m ÷ US$441m (Based on the trailing twelve months to April 2025).
The 'return' refers to a company's earnings over the last year. That means that for every $1 worth of shareholders' equity, the company generated $0.24 in profit.
View our latest analysis for Exponent
What Has ROE Got To Do With Earnings Growth?
So far, we've learned that ROE is a measure of a company's profitability. We now need to evaluate how much profit the company reinvests or "retains" for future growth which then gives us an idea about the growth potential of the company. Assuming all else is equal, companies that have both a higher return on equity and higher profit retention are usually the ones that have a higher growth rate when compared to companies that don't have the same features.
Exponent's Earnings Growth And 24% ROE
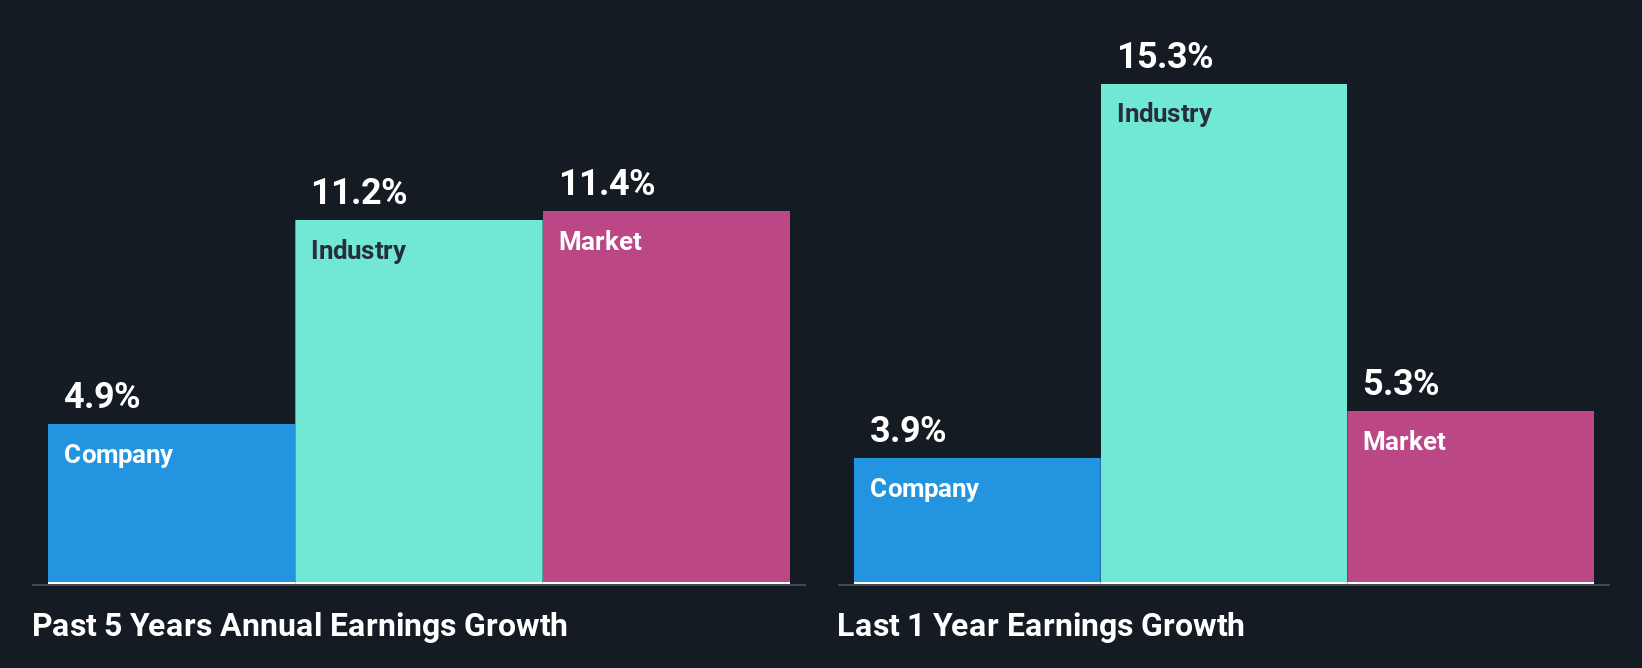
To begin with, Exponent has a pretty high ROE which is interesting. Additionally, the company's ROE is higher compared to the industry average of 20% which is quite remarkable. However, for some reason, the higher returns aren't reflected in Exponent's meagre five year net income growth average of 4.9%. This is generally not the case as when a company has a high rate of return it should usually also have a high earnings growth rate. A few likely reasons why this could happen is that the company could have a high payout ratio or the business has allocated capital poorly, for instance.
As a next step, we compared Exponent's net income growth with the industry and were disappointed to see that the company's growth is lower than the industry average growth of 11% in the same period.
The basis for attaching value to a company is, to a great extent, tied to its earnings growth. It’s important for an investor to know whether the market has priced in the company's expected earnings growth (or decline). Doing so will help them establish if the stock's future looks promising or ominous. One good indicator of expected earnings growth is the P/E ratio which determines the price the market is willing to pay for a stock based on its earnings prospects. So, you may want to check if Exponent is trading on a high P/E or a low P/E, relative to its industry.
Is Exponent Making Efficient Use Of Its Profits?
With a high three-year median payout ratio of 52% (or a retention ratio of 48%), most of Exponent's profits are being paid to shareholders. This definitely contributes to the low earnings growth seen by the company.
In addition, Exponent has been paying dividends over a period of at least ten years suggesting that keeping up dividend payments is way more important to the management even if it comes at the cost of business growth. Our latest analyst data shows that the future payout ratio of the company over the next three years is expected to be approximately 53%. Accordingly, forecasts suggest that Exponent's future ROE will be 21% which is again, similar to the current ROE.

Conclusion
On the whole, we do feel that Exponent has some positive attributes. Yet, the low earnings growth is a bit concerning, especially given that the company has a high rate of return. Investors could have benefitted from the high ROE, had the company been reinvesting more of its earnings. As discussed earlier, the company is retaining a small portion of its profits. With that said, the latest industry analyst forecasts reveal that the company's earnings growth is expected to slow down. To know more about the company's future earnings growth forecasts take a look at this free report on analyst forecasts for the company to find out more.
Have feedback on this article? Concerned about the content? Get in touch with us directly. Alternatively, email editorial-team (at) simplywallst.com.
This article by Simply Wall St is general in nature. We provide commentary based on historical data and analyst forecasts only using an unbiased methodology and our articles are not intended to be financial advice. It does not constitute a recommendation to buy or sell any stock, and does not take account of your objectives, or your financial situation. We aim to bring you long-term focused analysis driven by fundamental data. Note that our analysis may not factor in the latest price-sensitive company announcements or qualitative material. Simply Wall St has no position in any stocks mentioned.
① During the campaign period, US stocks, US stocks short selling, US stock options, Hong Kong stocks, and A-shares trading will maintain at $0 commission, and no subscription/redemption fees for mutual fund transactions. $0 fee offer has a time limit, until further notice. For more information, please visit: https://www.webull.hk/pricing
Webull Securities Limited is licensed with the Securities and Futures Commission of Hong Kong (CE No. BNG700) for carrying out Type 1 License for Dealing in Securities, Type 2 License for Dealing in Futures Contracts and Type 4 License for Advising on Securities.

English