We Think Helix Energy Solutions Group (NYSE:HLX) Can Stay On Top Of Its Debt
David Iben put it well when he said, 'Volatility is not a risk we care about. What we care about is avoiding the permanent loss of capital.' When we think about how risky a company is, we always like to look at its use of debt, since debt overload can lead to ruin. We can see that Helix Energy Solutions Group, Inc. (NYSE:HLX) does use debt in its business. But the more important question is: how much risk is that debt creating?
When Is Debt A Problem?
Debt is a tool to help businesses grow, but if a business is incapable of paying off its lenders, then it exists at their mercy. Ultimately, if the company can't fulfill its legal obligations to repay debt, shareholders could walk away with nothing. However, a more frequent (but still costly) occurrence is where a company must issue shares at bargain-basement prices, permanently diluting shareholders, just to shore up its balance sheet. Of course, debt can be an important tool in businesses, particularly capital heavy businesses. When we think about a company's use of debt, we first look at cash and debt together.
What Is Helix Energy Solutions Group's Net Debt?
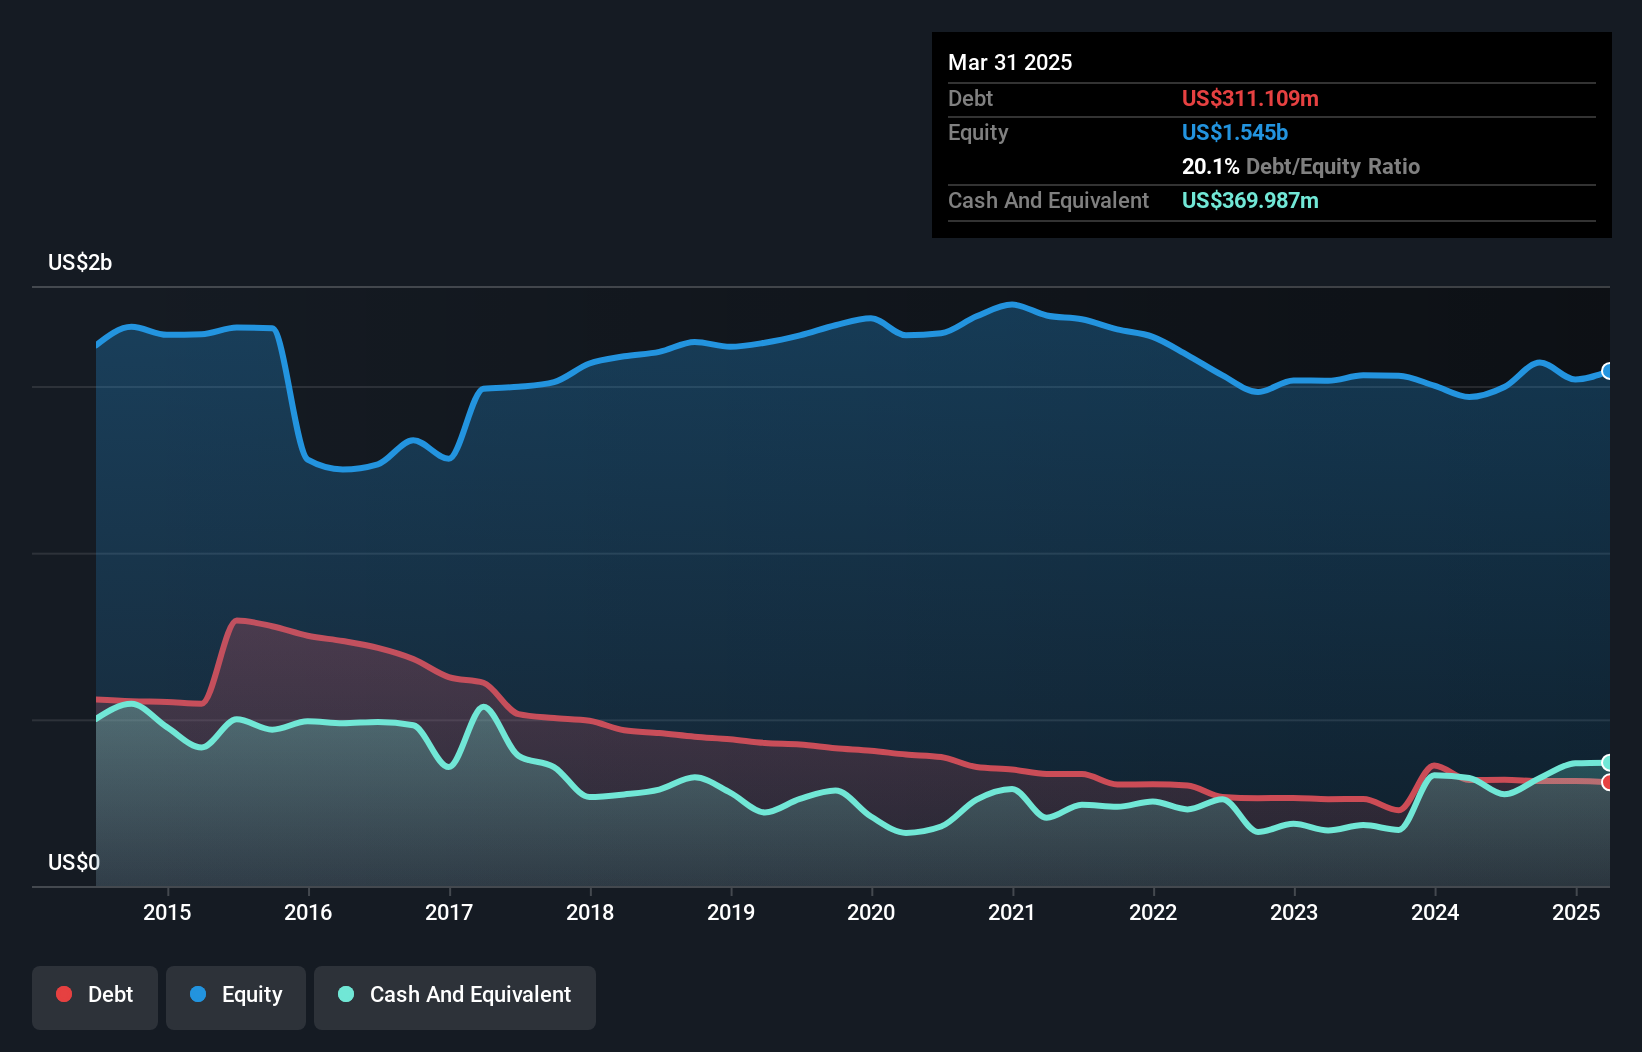
The chart below, which you can click on for greater detail, shows that Helix Energy Solutions Group had US$311.1m in debt in March 2025; about the same as the year before. But on the other hand it also has US$370.0m in cash, leading to a US$58.9m net cash position.
How Strong Is Helix Energy Solutions Group's Balance Sheet?
According to the last reported balance sheet, Helix Energy Solutions Group had liabilities of US$323.4m due within 12 months, and liabilities of US$766.4m due beyond 12 months. Offsetting these obligations, it had cash of US$370.0m as well as receivables valued at US$293.9m due within 12 months. So its liabilities outweigh the sum of its cash and (near-term) receivables by US$425.9m.
Helix Energy Solutions Group has a market capitalization of US$1.00b, so it could very likely raise cash to ameliorate its balance sheet, if the need arose. But we definitely want to keep our eyes open to indications that its debt is bringing too much risk. While it does have liabilities worth noting, Helix Energy Solutions Group also has more cash than debt, so we're pretty confident it can manage its debt safely.
See our latest analysis for Helix Energy Solutions Group
Also relevant is that Helix Energy Solutions Group has grown its EBIT by a very respectable 26% in the last year, thus enhancing its ability to pay down debt. There's no doubt that we learn most about debt from the balance sheet. But ultimately the future profitability of the business will decide if Helix Energy Solutions Group can strengthen its balance sheet over time. So if you're focused on the future you can check out this free report showing analyst profit forecasts.
Finally, a company can only pay off debt with cold hard cash, not accounting profits. While Helix Energy Solutions Group has net cash on its balance sheet, it's still worth taking a look at its ability to convert earnings before interest and tax (EBIT) to free cash flow, to help us understand how quickly it is building (or eroding) that cash balance. Happily for any shareholders, Helix Energy Solutions Group actually produced more free cash flow than EBIT over the last three years. That sort of strong cash conversion gets us as excited as the crowd when the beat drops at a Daft Punk concert.
Summing Up
While Helix Energy Solutions Group does have more liabilities than liquid assets, it also has net cash of US$58.9m. And it impressed us with free cash flow of US$114m, being 138% of its EBIT. So we don't think Helix Energy Solutions Group's use of debt is risky. We'd be motivated to research the stock further if we found out that Helix Energy Solutions Group insiders have bought shares recently. If you would too, then you're in luck, since today we're sharing our list of reported insider transactions for free.
Of course, if you're the type of investor who prefers buying stocks without the burden of debt, then don't hesitate to discover our exclusive list of net cash growth stocks, today.
Have feedback on this article? Concerned about the content? Get in touch with us directly. Alternatively, email editorial-team (at) simplywallst.com.
This article by Simply Wall St is general in nature. We provide commentary based on historical data and analyst forecasts only using an unbiased methodology and our articles are not intended to be financial advice. It does not constitute a recommendation to buy or sell any stock, and does not take account of your objectives, or your financial situation. We aim to bring you long-term focused analysis driven by fundamental data. Note that our analysis may not factor in the latest price-sensitive company announcements or qualitative material. Simply Wall St has no position in any stocks mentioned.
① During the campaign period, US stocks, US stocks short selling, US stock options, Hong Kong stocks, and A-shares trading will maintain at $0 commission, and no subscription/redemption fees for mutual fund transactions. $0 fee offer has a time limit, until further notice. For more information, please visit: https://www.webull.hk/pricing
Webull Securities Limited is licensed with the Securities and Futures Commission of Hong Kong (CE No. BNG700) for carrying out Type 1 License for Dealing in Securities, Type 2 License for Dealing in Futures Contracts and Type 4 License for Advising on Securities.

English