
With A 26% Price Drop For EPS Creative Health Technology Group Limited (HKG:3860) You'll Still Get What You Pay For
To the annoyance of some shareholders, EPS Creative Health Technology Group Limited (HKG:3860) shares are down a considerable 26% in the last month, which continues a horrid run for the company. The drop over the last 30 days has capped off a tough year for shareholders, with the share price down 47% in that time.
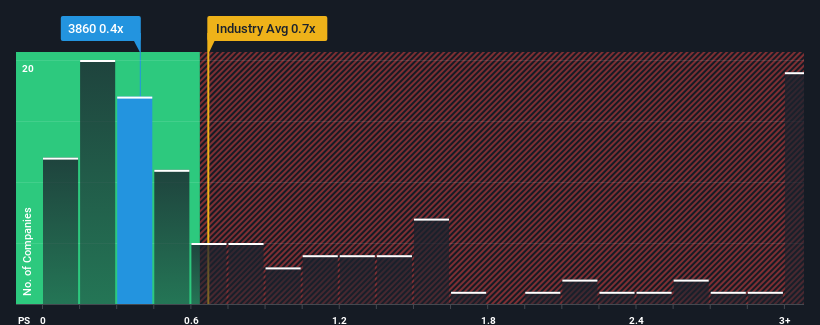
In spite of the heavy fall in price, you could still be forgiven for feeling indifferent about EPS Creative Health Technology Group's P/S ratio of 0.4x, since the median price-to-sales (or "P/S") ratio for the Luxury industry in Hong Kong is also close to 0.7x. While this might not raise any eyebrows, if the P/S ratio is not justified investors could be missing out on a potential opportunity or ignoring looming disappointment.
View our latest analysis for EPS Creative Health Technology Group
What Does EPS Creative Health Technology Group's Recent Performance Look Like?
Revenue has risen firmly for EPS Creative Health Technology Group recently, which is pleasing to see. Perhaps the market is expecting future revenue performance to only keep up with the broader industry, which has keeping the P/S in line with expectations. If that doesn't eventuate, then existing shareholders probably aren't too pessimistic about the future direction of the share price.
Want the full picture on earnings, revenue and cash flow for the company? Then our free report on EPS Creative Health Technology Group will help you shine a light on its historical performance.What Are Revenue Growth Metrics Telling Us About The P/S?
There's an inherent assumption that a company should be matching the industry for P/S ratios like EPS Creative Health Technology Group's to be considered reasonable.
Retrospectively, the last year delivered a decent 15% gain to the company's revenues. This was backed up an excellent period prior to see revenue up by 42% in total over the last three years. Accordingly, shareholders would have definitely welcomed those medium-term rates of revenue growth.
It's interesting to note that the rest of the industry is similarly expected to grow by 13% over the next year, which is fairly even with the company's recent medium-term annualised growth rates.
In light of this, it's understandable that EPS Creative Health Technology Group's P/S sits in line with the majority of other companies. It seems most investors are expecting to see average growth rates continue into the future and are only willing to pay a moderate amount for the stock.
The Key Takeaway
With its share price dropping off a cliff, the P/S for EPS Creative Health Technology Group looks to be in line with the rest of the Luxury industry. Using the price-to-sales ratio alone to determine if you should sell your stock isn't sensible, however it can be a practical guide to the company's future prospects.
As we've seen, EPS Creative Health Technology Group's three-year revenue trends seem to be contributing to its P/S, given they look similar to current industry expectations. Currently, with a past revenue trend that aligns closely wit the industry outlook, shareholders are confident the company's future revenue outlook won't contain any major surprises. If recent medium-term revenue trends continue, it's hard to see the share price moving strongly in either direction in the near future under these circumstances.
And what about other risks? Every company has them, and we've spotted 3 warning signs for EPS Creative Health Technology Group (of which 1 can't be ignored!) you should know about.
Of course, profitable companies with a history of great earnings growth are generally safer bets. So you may wish to see this free collection of other companies that have reasonable P/E ratios and have grown earnings strongly.
Have feedback on this article? Concerned about the content? Get in touch with us directly. Alternatively, email editorial-team (at) simplywallst.com.
This article by Simply Wall St is general in nature. We provide commentary based on historical data and analyst forecasts only using an unbiased methodology and our articles are not intended to be financial advice. It does not constitute a recommendation to buy or sell any stock, and does not take account of your objectives, or your financial situation. We aim to bring you long-term focused analysis driven by fundamental data. Note that our analysis may not factor in the latest price-sensitive company announcements or qualitative material. Simply Wall St has no position in any stocks mentioned.
Contact Us
Contact Number : +852 3852 8500Service Email : service@webull.hkBusiness Cooperation : marketinghk@webull.hkWebull Securities Limited is licensed with the Securities and Futures Commission of Hong Kong (CE No. BNG700) for carrying out Type 1 License for Dealing in Securities, Type 2 License for Dealing in Futures Contracts and Type 4 License for Advising on Securities.

English