
Are Robust Financials Driving The Recent Rally In Techtronic Industries Company Limited's (HKG:669) Stock?
Techtronic Industries (HKG:669) has had a great run on the share market with its stock up by a significant 20% over the last month. Given that the market rewards strong financials in the long-term, we wonder if that is the case in this instance. Specifically, we decided to study Techtronic Industries' ROE in this article.
Return on equity or ROE is a key measure used to assess how efficiently a company's management is utilizing the company's capital. Put another way, it reveals the company's success at turning shareholder investments into profits.
How Do You Calculate Return On Equity?
The formula for return on equity is:
Return on Equity = Net Profit (from continuing operations) ÷ Shareholders' Equity
So, based on the above formula, the ROE for Techtronic Industries is:
18% = US$1.1b ÷ US$6.4b (Based on the trailing twelve months to December 2024).
The 'return' refers to a company's earnings over the last year. One way to conceptualize this is that for each HK$1 of shareholders' capital it has, the company made HK$0.18 in profit.
Check out our latest analysis for Techtronic Industries
What Is The Relationship Between ROE And Earnings Growth?
So far, we've learned that ROE is a measure of a company's profitability. Based on how much of its profits the company chooses to reinvest or "retain", we are then able to evaluate a company's future ability to generate profits. Assuming everything else remains unchanged, the higher the ROE and profit retention, the higher the growth rate of a company compared to companies that don't necessarily bear these characteristics.
Techtronic Industries' Earnings Growth And 18% ROE
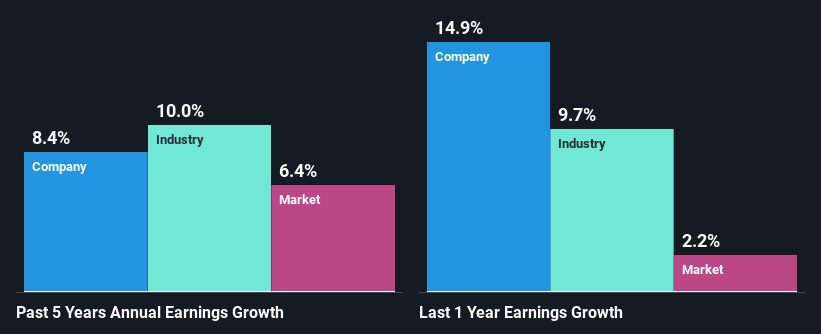
At first glance, Techtronic Industries seems to have a decent ROE. Especially when compared to the industry average of 8.4% the company's ROE looks pretty impressive. This certainly adds some context to Techtronic Industries' decent 8.4% net income growth seen over the past five years.
We then performed a comparison between Techtronic Industries' net income growth with the industry, which revealed that the company's growth is similar to the average industry growth of 10.0% in the same 5-year period.
Earnings growth is an important metric to consider when valuing a stock. What investors need to determine next is if the expected earnings growth, or the lack of it, is already built into the share price. Doing so will help them establish if the stock's future looks promising or ominous. Has the market priced in the future outlook for 669? You can find out in our latest intrinsic value infographic research report.
Is Techtronic Industries Using Its Retained Earnings Effectively?
With a three-year median payout ratio of 42% (implying that the company retains 58% of its profits), it seems that Techtronic Industries is reinvesting efficiently in a way that it sees respectable amount growth in its earnings and pays a dividend that's well covered.
Besides, Techtronic Industries has been paying dividends for at least ten years or more. This shows that the company is committed to sharing profits with its shareholders. Based on the latest analysts' estimates, we found that the company's future payout ratio over the next three years is expected to hold steady at 45%. As a result, Techtronic Industries' ROE is not expected to change by much either, which we inferred from the analyst estimate of 21% for future ROE.
Conclusion
In total, we are pretty happy with Techtronic Industries' performance. Particularly, we like that the company is reinvesting heavily into its business, and at a high rate of return. Unsurprisingly, this has led to an impressive earnings growth. With that said, the latest industry analyst forecasts reveal that the company's earnings are expected to accelerate. To know more about the latest analysts predictions for the company, check out this visualization of analyst forecasts for the company.
Have feedback on this article? Concerned about the content? Get in touch with us directly. Alternatively, email editorial-team (at) simplywallst.com.
This article by Simply Wall St is general in nature. We provide commentary based on historical data and analyst forecasts only using an unbiased methodology and our articles are not intended to be financial advice. It does not constitute a recommendation to buy or sell any stock, and does not take account of your objectives, or your financial situation. We aim to bring you long-term focused analysis driven by fundamental data. Note that our analysis may not factor in the latest price-sensitive company announcements or qualitative material. Simply Wall St has no position in any stocks mentioned.
Contact Us
Contact Number : +852 3852 8500Service Email : service@webull.hkBusiness Cooperation : marketinghk@webull.hkWebull Securities Limited is licensed with the Securities and Futures Commission of Hong Kong (CE No. BNG700) for carrying out Type 1 License for Dealing in Securities, Type 2 License for Dealing in Futures Contracts and Type 4 License for Advising on Securities.

English