
China Tianrui Automotive Interiors Co., LTD's (HKG:6162) 28% Share Price Surge Not Quite Adding Up
China Tianrui Automotive Interiors Co., LTD (HKG:6162) shares have continued their recent momentum with a 28% gain in the last month alone. Looking back a bit further, it's encouraging to see the stock is up 71% in the last year.
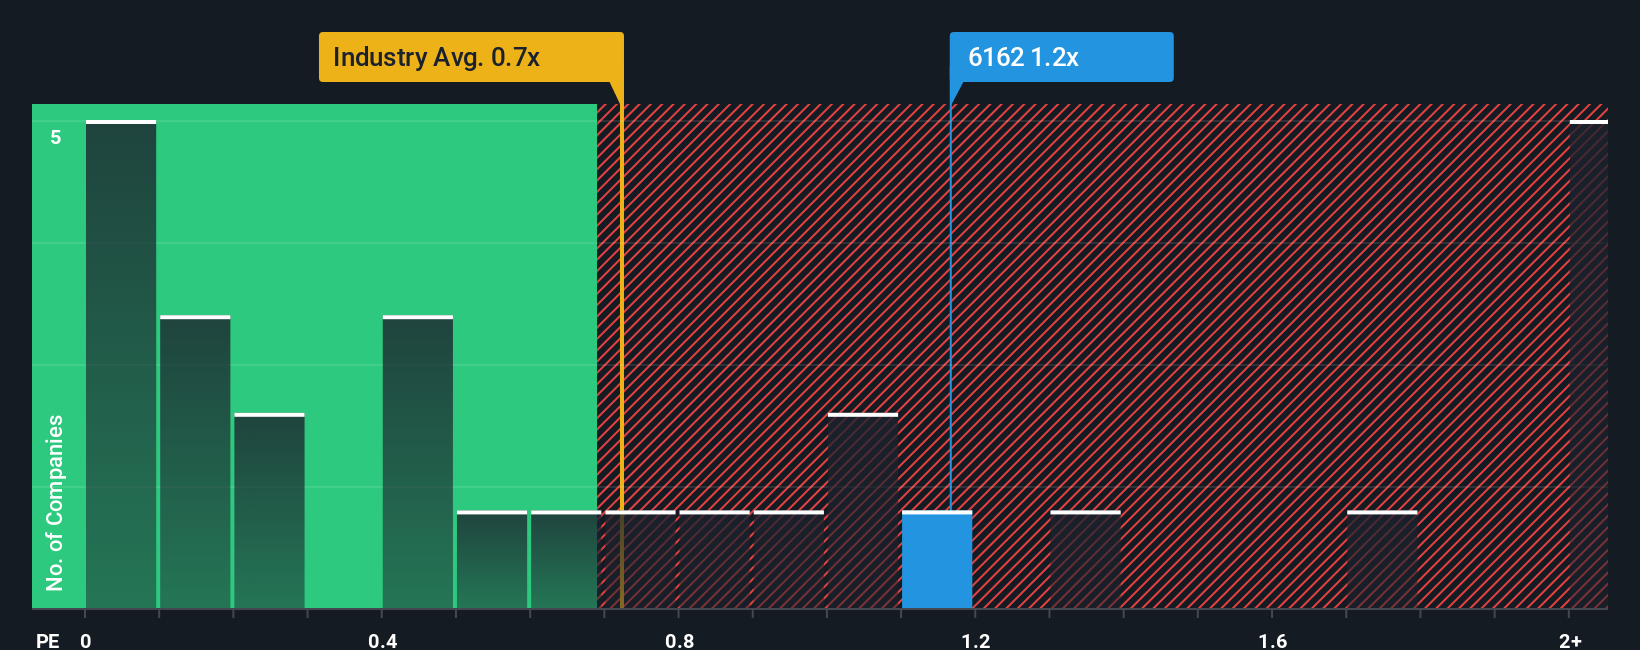
Even after such a large jump in price, it's still not a stretch to say that China Tianrui Automotive Interiors' price-to-sales (or "P/S") ratio of 1.2x right now seems quite "middle-of-the-road" compared to the Auto Components industry in Hong Kong, where the median P/S ratio is around 0.7x. Although, it's not wise to simply ignore the P/S without explanation as investors may be disregarding a distinct opportunity or a costly mistake.
Check out our latest analysis for China Tianrui Automotive Interiors
How Has China Tianrui Automotive Interiors Performed Recently?
For example, consider that China Tianrui Automotive Interiors' financial performance has been poor lately as its revenue has been in decline. Perhaps investors believe the recent revenue performance is enough to keep in line with the industry, which is keeping the P/S from dropping off. If not, then existing shareholders may be a little nervous about the viability of the share price.
Want the full picture on earnings, revenue and cash flow for the company? Then our free report on China Tianrui Automotive Interiors will help you shine a light on its historical performance.Do Revenue Forecasts Match The P/S Ratio?
In order to justify its P/S ratio, China Tianrui Automotive Interiors would need to produce growth that's similar to the industry.
Retrospectively, the last year delivered a frustrating 1.2% decrease to the company's top line. The last three years don't look nice either as the company has shrunk revenue by 18% in aggregate. Therefore, it's fair to say the revenue growth recently has been undesirable for the company.
Weighing that medium-term revenue trajectory against the broader industry's one-year forecast for expansion of 18% shows it's an unpleasant look.
With this information, we find it concerning that China Tianrui Automotive Interiors is trading at a fairly similar P/S compared to the industry. Apparently many investors in the company are way less bearish than recent times would indicate and aren't willing to let go of their stock right now. There's a good chance existing shareholders are setting themselves up for future disappointment if the P/S falls to levels more in line with the recent negative growth rates.

What Does China Tianrui Automotive Interiors' P/S Mean For Investors?
Its shares have lifted substantially and now China Tianrui Automotive Interiors' P/S is back within range of the industry median. It's argued the price-to-sales ratio is an inferior measure of value within certain industries, but it can be a powerful business sentiment indicator.
We find it unexpected that China Tianrui Automotive Interiors trades at a P/S ratio that is comparable to the rest of the industry, despite experiencing declining revenues during the medium-term, while the industry as a whole is expected to grow. Even though it matches the industry, we're uncomfortable with the current P/S ratio, as this dismal revenue performance is unlikely to support a more positive sentiment for long. If recent medium-term revenue trends continue, it will place shareholders' investments at risk and potential investors in danger of paying an unnecessary premium.
You should always think about risks. Case in point, we've spotted 3 warning signs for China Tianrui Automotive Interiors you should be aware of, and 1 of them makes us a bit uncomfortable.
If strong companies turning a profit tickle your fancy, then you'll want to check out this free list of interesting companies that trade on a low P/E (but have proven they can grow earnings).
Have feedback on this article? Concerned about the content? Get in touch with us directly. Alternatively, email editorial-team (at) simplywallst.com.
This article by Simply Wall St is general in nature. We provide commentary based on historical data and analyst forecasts only using an unbiased methodology and our articles are not intended to be financial advice. It does not constitute a recommendation to buy or sell any stock, and does not take account of your objectives, or your financial situation. We aim to bring you long-term focused analysis driven by fundamental data. Note that our analysis may not factor in the latest price-sensitive company announcements or qualitative material. Simply Wall St has no position in any stocks mentioned.
Contact Us
Contact Number : +852 3852 8500Service Email : service@webull.hkBusiness Cooperation : marketinghk@webull.hkWebull Securities Limited is licensed with the Securities and Futures Commission of Hong Kong (CE No. BNG700) for carrying out Type 1 License for Dealing in Securities, Type 2 License for Dealing in Futures Contracts and Type 4 License for Advising on Securities.

English