
Calculating The Intrinsic Value Of InnoScience (Suzhou) Technology Holding Co., Ltd. (HKG:2577)
Key Insights
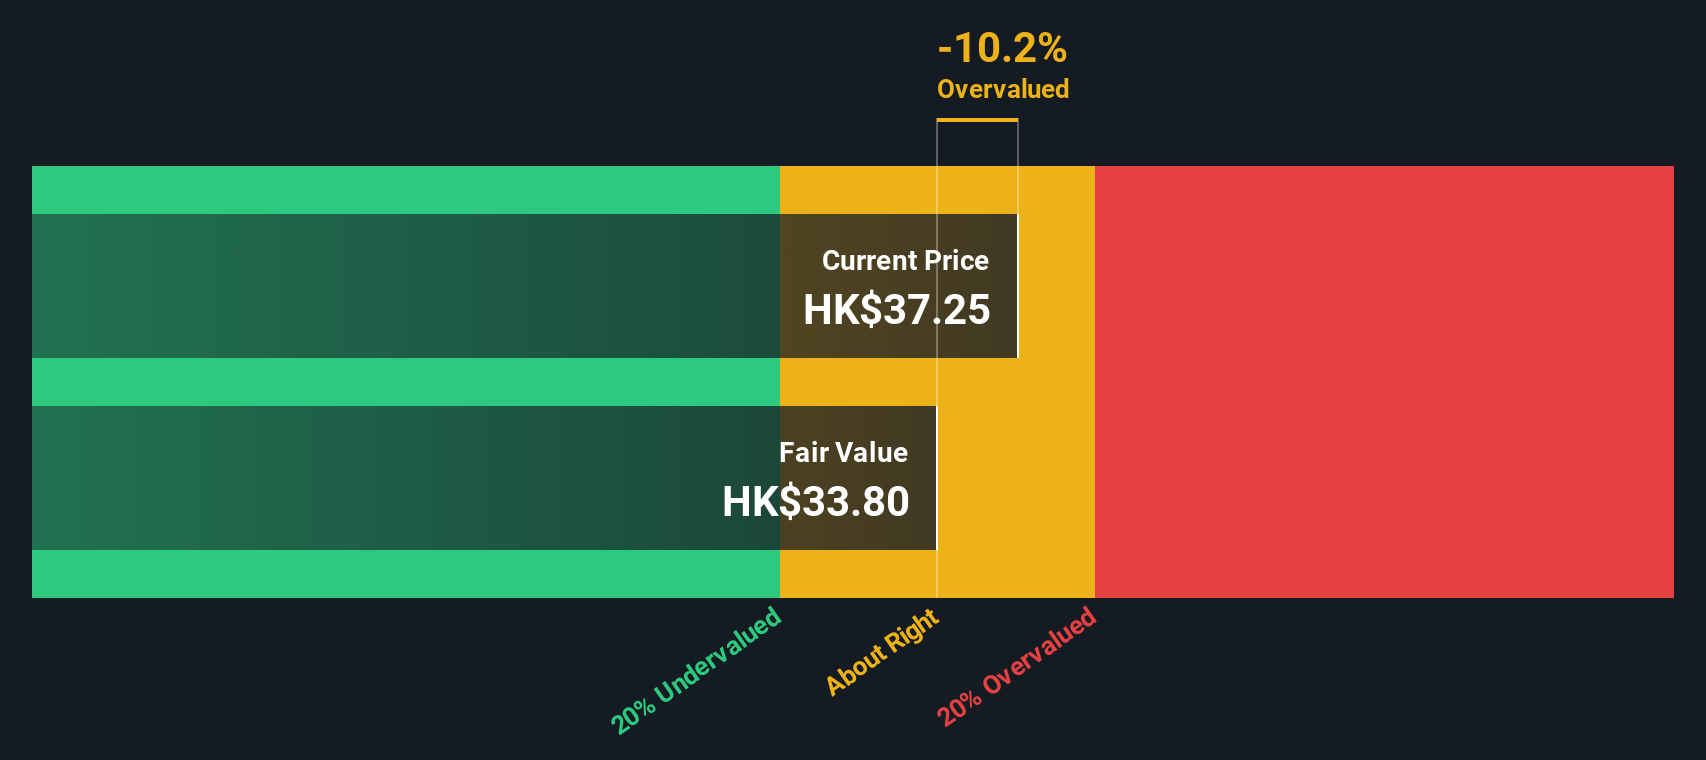
- InnoScience (Suzhou) Technology Holding's estimated fair value is HK$33.80 based on 2 Stage Free Cash Flow to Equity
- Current share price of HK$37.25 suggests InnoScience (Suzhou) Technology Holding is potentially trading close to its fair value
- Industry average of 64% suggests InnoScience (Suzhou) Technology Holding's peers are currently trading at a higher premium to fair value
Today we will run through one way of estimating the intrinsic value of InnoScience (Suzhou) Technology Holding Co., Ltd. (HKG:2577) by taking the expected future cash flows and discounting them to today's value. We will use the Discounted Cash Flow (DCF) model on this occasion. There's really not all that much to it, even though it might appear quite complex.
We would caution that there are many ways of valuing a company and, like the DCF, each technique has advantages and disadvantages in certain scenarios. For those who are keen learners of equity analysis, the Simply Wall St analysis model here may be something of interest to you.
Is InnoScience (Suzhou) Technology Holding Fairly Valued?
We're using the 2-stage growth model, which simply means we take in account two stages of company's growth. In the initial period the company may have a higher growth rate and the second stage is usually assumed to have a stable growth rate. In the first stage we need to estimate the cash flows to the business over the next ten years. Where possible we use analyst estimates, but when these aren't available we extrapolate the previous free cash flow (FCF) from the last estimate or reported value. We assume companies with shrinking free cash flow will slow their rate of shrinkage, and that companies with growing free cash flow will see their growth rate slow, over this period. We do this to reflect that growth tends to slow more in the early years than it does in later years.
Generally we assume that a dollar today is more valuable than a dollar in the future, so we discount the value of these future cash flows to their estimated value in today's dollars:
10-year free cash flow (FCF) forecast
| 2025 | 2026 | 2027 | 2028 | 2029 | 2030 | 2031 | 2032 | 2033 | 2034 | |
| Levered FCF (CN¥, Millions) | -CN¥546.3m | -CN¥1.40b | -CN¥1.16b | CN¥1.45b | CN¥2.02b | CN¥2.59b | CN¥3.12b | CN¥3.59b | CN¥4.00b | CN¥4.35b |
| Growth Rate Estimate Source | Analyst x1 | Analyst x1 | Analyst x1 | Analyst x1 | Est @ 39.11% | Est @ 28.15% | Est @ 20.48% | Est @ 15.12% | Est @ 11.36% | Est @ 8.73% |
| Present Value (CN¥, Millions) Discounted @ 11% | -CN¥493 | -CN¥1.1k | -CN¥855 | CN¥967 | CN¥1.2k | CN¥1.4k | CN¥1.5k | CN¥1.6k | CN¥1.6k | CN¥1.6k |
("Est" = FCF growth rate estimated by Simply Wall St)
Present Value of 10-year Cash Flow (PVCF) = CN¥7.4b
We now need to calculate the Terminal Value, which accounts for all the future cash flows after this ten year period. The Gordon Growth formula is used to calculate Terminal Value at a future annual growth rate equal to the 5-year average of the 10-year government bond yield of 2.6%. We discount the terminal cash flows to today's value at a cost of equity of 11%.
Terminal Value (TV)= FCF2034 × (1 + g) ÷ (r – g) = CN¥4.4b× (1 + 2.6%) ÷ (11%– 2.6%) = CN¥55b
Present Value of Terminal Value (PVTV)= TV / (1 + r)10= CN¥55b÷ ( 1 + 11%)10= CN¥20b
The total value is the sum of cash flows for the next ten years plus the discounted terminal value, which results in the Total Equity Value, which in this case is CN¥27b. The last step is to then divide the equity value by the number of shares outstanding. Compared to the current share price of HK$37.3, the company appears around fair value at the time of writing. Remember though, that this is just an approximate valuation, and like any complex formula - garbage in, garbage out.
The Assumptions
The calculation above is very dependent on two assumptions. The first is the discount rate and the other is the cash flows. Part of investing is coming up with your own evaluation of a company's future performance, so try the calculation yourself and check your own assumptions. The DCF also does not consider the possible cyclicality of an industry, or a company's future capital requirements, so it does not give a full picture of a company's potential performance. Given that we are looking at InnoScience (Suzhou) Technology Holding as potential shareholders, the cost of equity is used as the discount rate, rather than the cost of capital (or weighted average cost of capital, WACC) which accounts for debt. In this calculation we've used 11%, which is based on a levered beta of 1.545. Beta is a measure of a stock's volatility, compared to the market as a whole. We get our beta from the industry average beta of globally comparable companies, with an imposed limit between 0.8 and 2.0, which is a reasonable range for a stable business.
See our latest analysis for InnoScience (Suzhou) Technology Holding
SWOT Analysis for InnoScience (Suzhou) Technology Holding
- Debt is well covered by earnings.
- Expensive based on P/S ratio and estimated fair value.
- Forecast to reduce losses next year.
- Has sufficient cash runway for more than 3 years based on current free cash flows.
- Debt is not well covered by operating cash flow.
Moving On:
Whilst important, the DCF calculation shouldn't be the only metric you look at when researching a company. The DCF model is not a perfect stock valuation tool. Preferably you'd apply different cases and assumptions and see how they would impact the company's valuation. For instance, if the terminal value growth rate is adjusted slightly, it can dramatically alter the overall result. For InnoScience (Suzhou) Technology Holding, we've put together three important elements you should look at:
- Financial Health: Does 2577 have a healthy balance sheet? Take a look at our free balance sheet analysis with six simple checks on key factors like leverage and risk.
- Future Earnings: How does 2577's growth rate compare to its peers and the wider market? Dig deeper into the analyst consensus number for the upcoming years by interacting with our free analyst growth expectation chart.
- Other Solid Businesses: Low debt, high returns on equity and good past performance are fundamental to a strong business. Why not explore our interactive list of stocks with solid business fundamentals to see if there are other companies you may not have considered!
PS. The Simply Wall St app conducts a discounted cash flow valuation for every stock on the SEHK every day. If you want to find the calculation for other stocks just search here.
Have feedback on this article? Concerned about the content? Get in touch with us directly. Alternatively, email editorial-team (at) simplywallst.com.
This article by Simply Wall St is general in nature. We provide commentary based on historical data and analyst forecasts only using an unbiased methodology and our articles are not intended to be financial advice. It does not constitute a recommendation to buy or sell any stock, and does not take account of your objectives, or your financial situation. We aim to bring you long-term focused analysis driven by fundamental data. Note that our analysis may not factor in the latest price-sensitive company announcements or qualitative material. Simply Wall St has no position in any stocks mentioned.
Contact Us
Contact Number :+852 3852 8500Webull Securities Limited is licensed with the Securities and Futures Commission of Hong Kong (CE No. BNG700) for carrying out Type 1 License for Dealing in Securities, Type 2 License for Dealing in Futures Contracts and Type 4 License for Advising on Securities.

English