Recent uptick might appease Nu Skin Enterprises, Inc. (NYSE:NUS) institutional owners after losing 15% over the past year
Key Insights
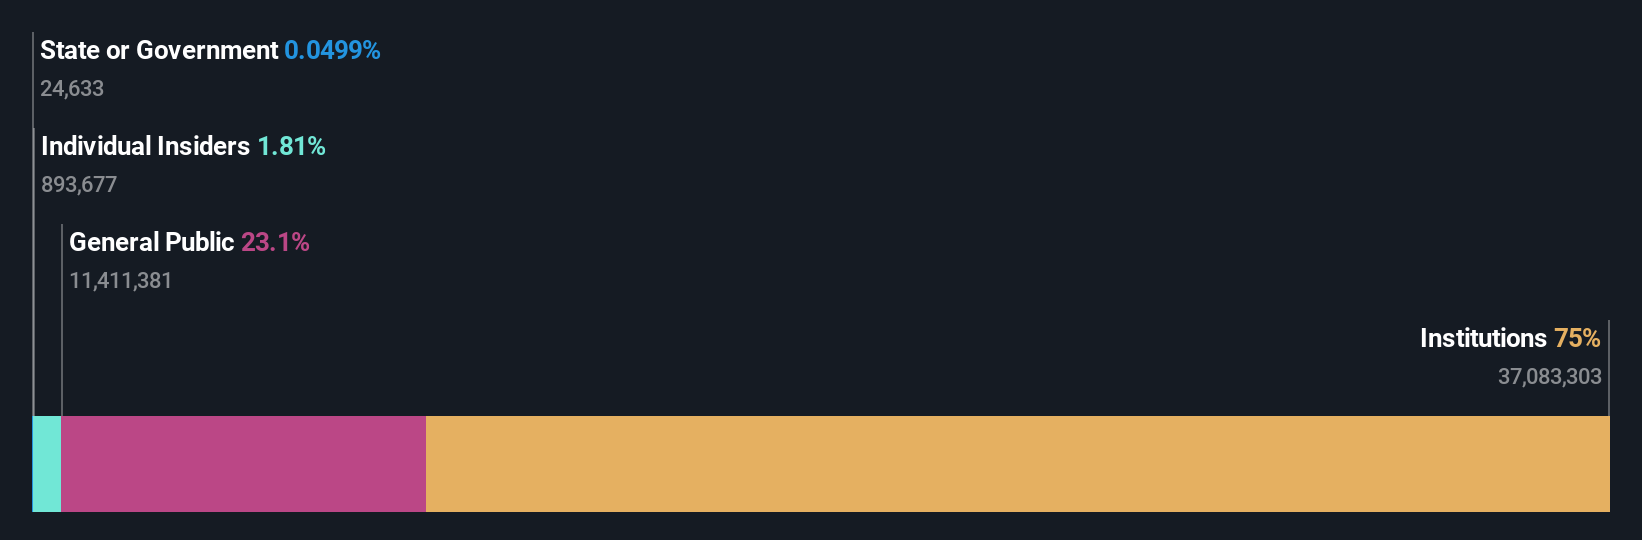
- Significantly high institutional ownership implies Nu Skin Enterprises' stock price is sensitive to their trading actions
- The top 18 shareholders own 51% of the company
- Insiders have been selling lately
If you want to know who really controls Nu Skin Enterprises, Inc. (NYSE:NUS), then you'll have to look at the makeup of its share registry. The group holding the most number of shares in the company, around 75% to be precise, is institutions. Put another way, the group faces the maximum upside potential (or downside risk).
After a year of 15% losses, last week’s 14% gain would be welcomed by institutional investors as a possible sign that returns might start trending higher.
Let's take a closer look to see what the different types of shareholders can tell us about Nu Skin Enterprises.
View our latest analysis for Nu Skin Enterprises
What Does The Institutional Ownership Tell Us About Nu Skin Enterprises?
Institutions typically measure themselves against a benchmark when reporting to their own investors, so they often become more enthusiastic about a stock once it's included in a major index. We would expect most companies to have some institutions on the register, especially if they are growing.
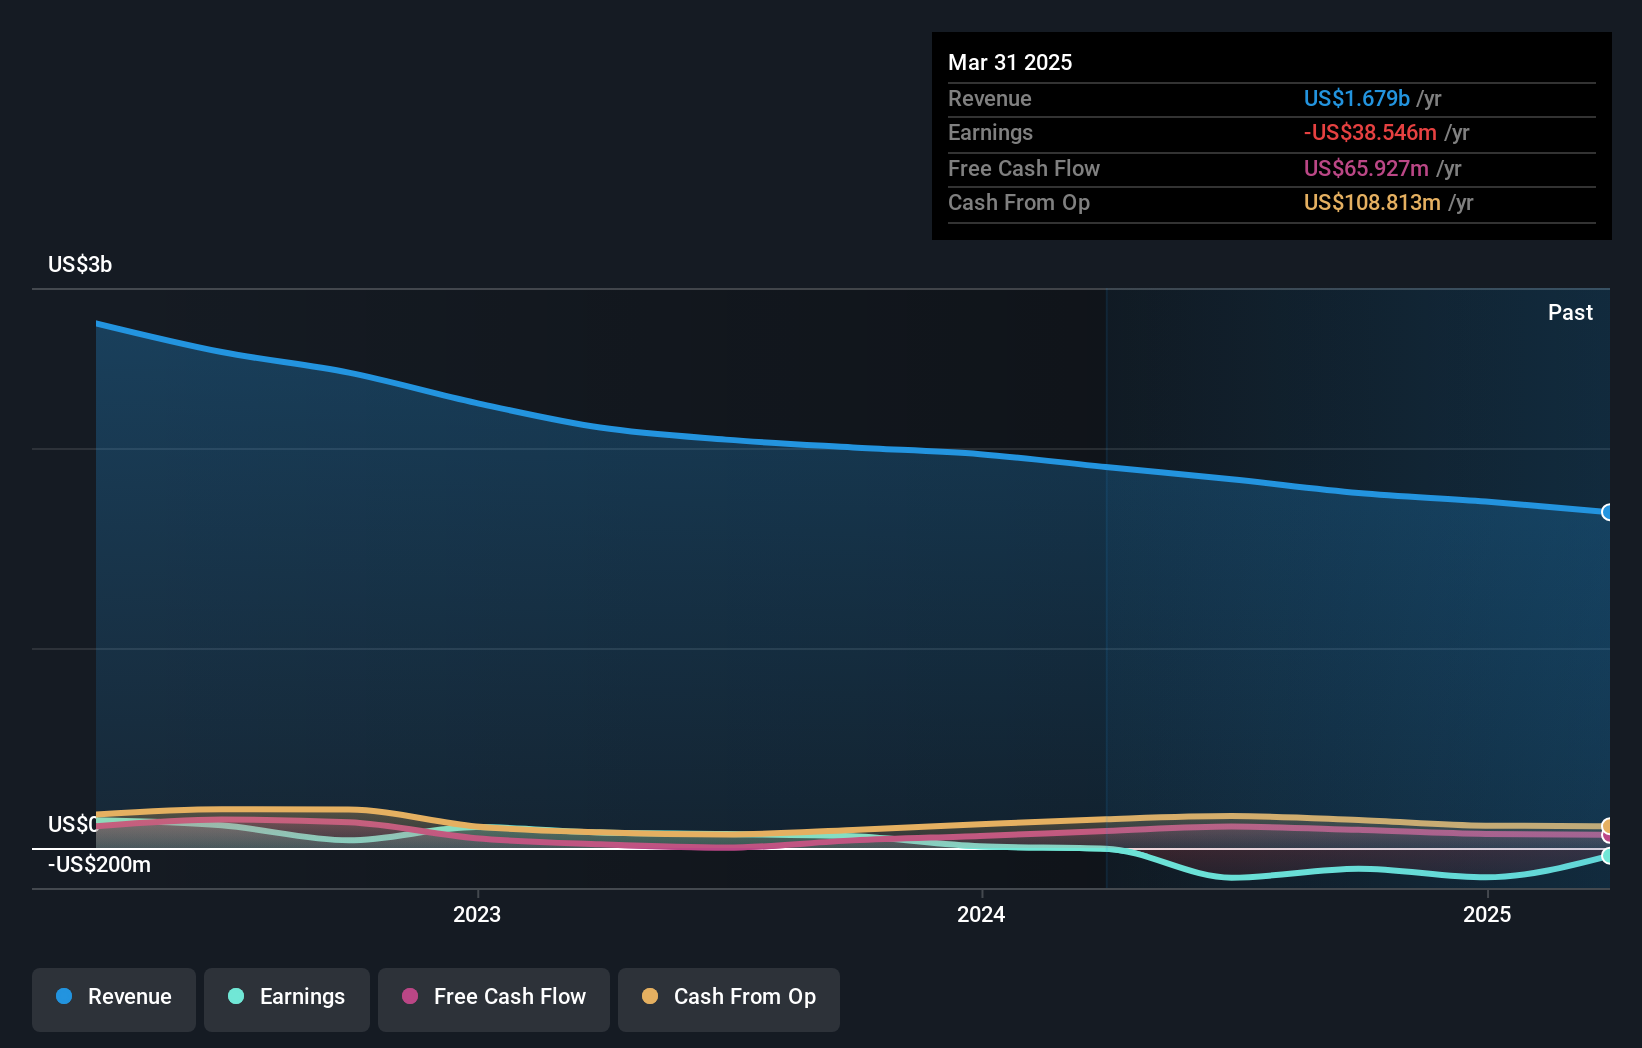
We can see that Nu Skin Enterprises does have institutional investors; and they hold a good portion of the company's stock. This can indicate that the company has a certain degree of credibility in the investment community. However, it is best to be wary of relying on the supposed validation that comes with institutional investors. They too, get it wrong sometimes. It is not uncommon to see a big share price drop if two large institutional investors try to sell out of a stock at the same time. So it is worth checking the past earnings trajectory of Nu Skin Enterprises, (below). Of course, keep in mind that there are other factors to consider, too.
Institutional investors own over 50% of the company, so together than can probably strongly influence board decisions. Hedge funds don't have many shares in Nu Skin Enterprises. BlackRock, Inc. is currently the company's largest shareholder with 9.2% of shares outstanding. The Vanguard Group, Inc. is the second largest shareholder owning 8.4% of common stock, and D. E. Shaw & Co., L.P. holds about 4.8% of the company stock.
After doing some more digging, we found that the top 18 have the combined ownership of 51% in the company, suggesting that no single shareholder has significant control over the company.
While studying institutional ownership for a company can add value to your research, it is also a good practice to research analyst recommendations to get a deeper understand of a stock's expected performance. We're not picking up on any analyst coverage of the stock at the moment, so the company is unlikely to be widely held.
Insider Ownership Of Nu Skin Enterprises
While the precise definition of an insider can be subjective, almost everyone considers board members to be insiders. The company management answer to the board and the latter should represent the interests of shareholders. Notably, sometimes top-level managers are on the board themselves.
Insider ownership is positive when it signals leadership are thinking like the true owners of the company. However, high insider ownership can also give immense power to a small group within the company. This can be negative in some circumstances.
Our most recent data indicates that insiders own some shares in Nu Skin Enterprises, Inc.. As individuals, the insiders collectively own US$7.1m worth of the US$395m company. Some would say this shows alignment of interests between shareholders and the board. But it might be worth checking if those insiders have been selling.
General Public Ownership
The general public-- including retail investors -- own 23% stake in the company, and hence can't easily be ignored. While this size of ownership may not be enough to sway a policy decision in their favour, they can still make a collective impact on company policies.
Next Steps:
I find it very interesting to look at who exactly owns a company. But to truly gain insight, we need to consider other information, too. Case in point: We've spotted 3 warning signs for Nu Skin Enterprises you should be aware of, and 1 of them is a bit concerning.
Of course this may not be the best stock to buy. Therefore, you may wish to see our free collection of interesting prospects boasting favorable financials.
NB: Figures in this article are calculated using data from the last twelve months, which refer to the 12-month period ending on the last date of the month the financial statement is dated. This may not be consistent with full year annual report figures.
Have feedback on this article? Concerned about the content? Get in touch with us directly. Alternatively, email editorial-team (at) simplywallst.com.
This article by Simply Wall St is general in nature. We provide commentary based on historical data and analyst forecasts only using an unbiased methodology and our articles are not intended to be financial advice. It does not constitute a recommendation to buy or sell any stock, and does not take account of your objectives, or your financial situation. We aim to bring you long-term focused analysis driven by fundamental data. Note that our analysis may not factor in the latest price-sensitive company announcements or qualitative material. Simply Wall St has no position in any stocks mentioned.
Contact Us
Contact Number : +852 3852 8500Service Email : service@webull.hkBusiness Cooperation : marketinghk@webull.hkWebull Securities Limited is licensed with the Securities and Futures Commission of Hong Kong (CE No. BNG700) for carrying out Type 1 License for Dealing in Securities, Type 2 License for Dealing in Futures Contracts and Type 4 License for Advising on Securities.

English