A Look At The Fair Value Of Nu Skin Enterprises, Inc. (NYSE:NUS)
Key Insights
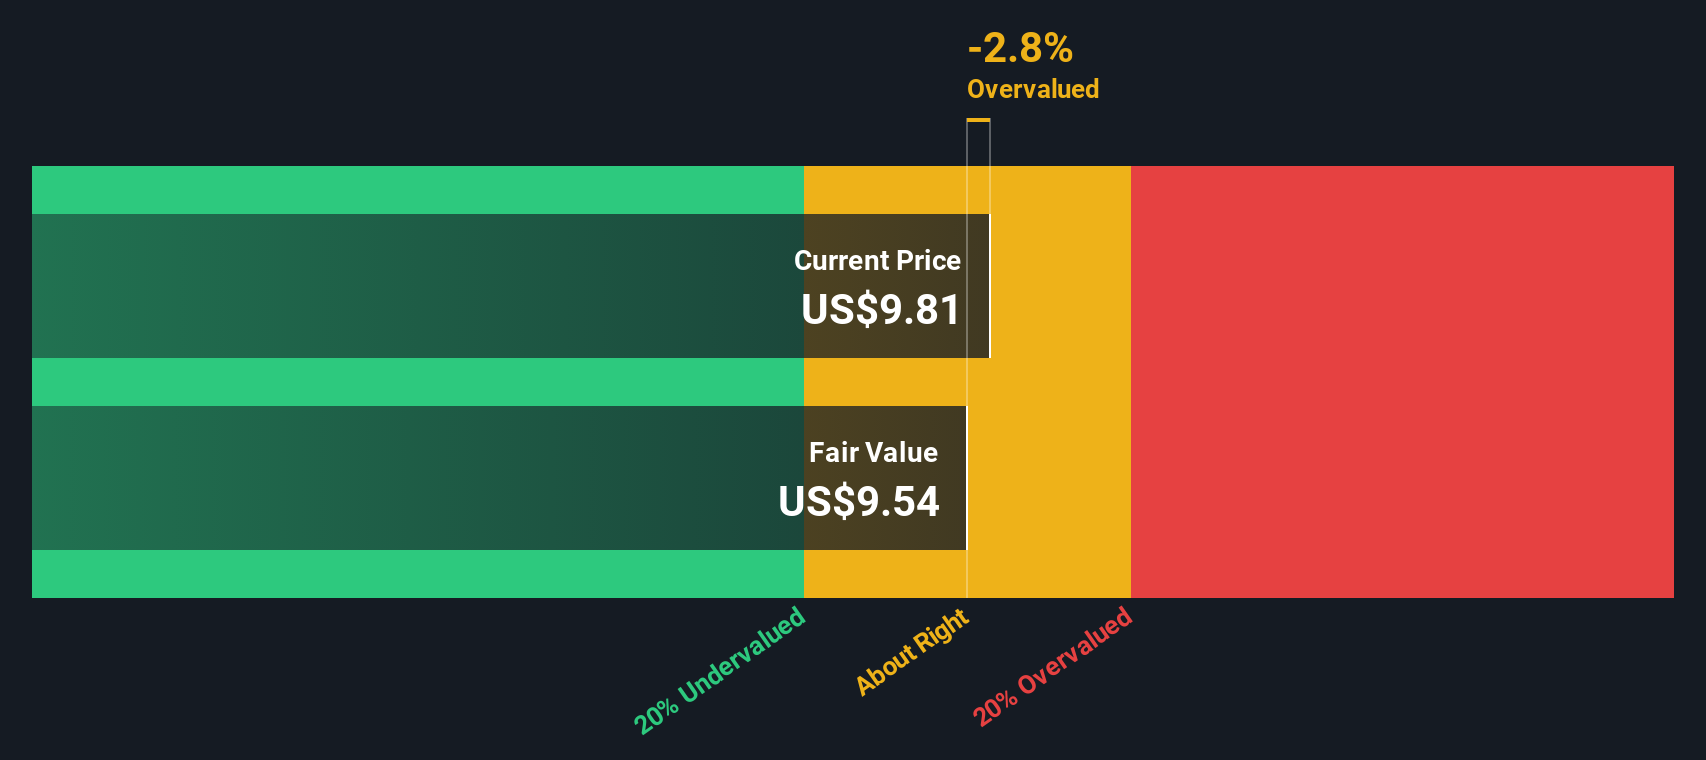
- The projected fair value for Nu Skin Enterprises is US$9.54 based on 2 Stage Free Cash Flow to Equity
- Nu Skin Enterprises' US$9.81 share price indicates it is trading at similar levels as its fair value estimate
- Nu Skin Enterprises' peers are currently trading at a discount of 30% on average
Does the July share price for Nu Skin Enterprises, Inc. (NYSE:NUS) reflect what it's really worth? Today, we will estimate the stock's intrinsic value by projecting its future cash flows and then discounting them to today's value. The Discounted Cash Flow (DCF) model is the tool we will apply to do this. It may sound complicated, but actually it is quite simple!
Companies can be valued in a lot of ways, so we would point out that a DCF is not perfect for every situation. If you still have some burning questions about this type of valuation, take a look at the Simply Wall St analysis model.
Is Nu Skin Enterprises Fairly Valued?
We use what is known as a 2-stage model, which simply means we have two different periods of growth rates for the company's cash flows. Generally the first stage is higher growth, and the second stage is a lower growth phase. To begin with, we have to get estimates of the next ten years of cash flows. Seeing as no analyst estimates of free cash flow are available to us, we have extrapolate the previous free cash flow (FCF) from the company's last reported value. We assume companies with shrinking free cash flow will slow their rate of shrinkage, and that companies with growing free cash flow will see their growth rate slow, over this period. We do this to reflect that growth tends to slow more in the early years than it does in later years.
Generally we assume that a dollar today is more valuable than a dollar in the future, and so the sum of these future cash flows is then discounted to today's value:
10-year free cash flow (FCF) forecast
| 2026 | 2027 | 2028 | 2029 | 2030 | 2031 | 2032 | 2033 | 2034 | 2035 | |
| Levered FCF ($, Millions) | US$46.4m | US$39.1m | US$35.1m | US$32.9m | US$31.8m | US$31.3m | US$31.2m | US$31.5m | US$31.9m | US$32.5m |
| Growth Rate Estimate Source | Est @ -23.76% | Est @ -15.75% | Est @ -10.14% | Est @ -6.22% | Est @ -3.47% | Est @ -1.55% | Est @ -0.20% | Est @ 0.74% | Est @ 1.40% | Est @ 1.86% |
| Present Value ($, Millions) Discounted @ 8.8% | US$42.6 | US$33.0 | US$27.2 | US$23.5 | US$20.8 | US$18.8 | US$17.3 | US$16.0 | US$14.9 | US$13.9 |
("Est" = FCF growth rate estimated by Simply Wall St)
Present Value of 10-year Cash Flow (PVCF) = US$228m
The second stage is also known as Terminal Value, this is the business's cash flow after the first stage. The Gordon Growth formula is used to calculate Terminal Value at a future annual growth rate equal to the 5-year average of the 10-year government bond yield of 2.9%. We discount the terminal cash flows to today's value at a cost of equity of 8.8%.
Terminal Value (TV)= FCF2035 × (1 + g) ÷ (r – g) = US$32m× (1 + 2.9%) ÷ (8.8%– 2.9%) = US$568m
Present Value of Terminal Value (PVTV)= TV / (1 + r)10= US$568m÷ ( 1 + 8.8%)10= US$244m
The total value is the sum of cash flows for the next ten years plus the discounted terminal value, which results in the Total Equity Value, which in this case is US$472m. The last step is to then divide the equity value by the number of shares outstanding. Compared to the current share price of US$9.8, the company appears around fair value at the time of writing. Valuations are imprecise instruments though, rather like a telescope - move a few degrees and end up in a different galaxy. Do keep this in mind.
The Assumptions
We would point out that the most important inputs to a discounted cash flow are the discount rate and of course the actual cash flows. You don't have to agree with these inputs, I recommend redoing the calculations yourself and playing with them. The DCF also does not consider the possible cyclicality of an industry, or a company's future capital requirements, so it does not give a full picture of a company's potential performance. Given that we are looking at Nu Skin Enterprises as potential shareholders, the cost of equity is used as the discount rate, rather than the cost of capital (or weighted average cost of capital, WACC) which accounts for debt. In this calculation we've used 8.8%, which is based on a levered beta of 1.361. Beta is a measure of a stock's volatility, compared to the market as a whole. We get our beta from the industry average beta of globally comparable companies, with an imposed limit between 0.8 and 2.0, which is a reasonable range for a stable business.
See our latest analysis for Nu Skin Enterprises
SWOT Analysis for Nu Skin Enterprises
- Debt is not viewed as a risk.
- Dividend is low compared to the top 25% of dividend payers in the Personal Products market.
- Current share price is above our estimate of fair value.
- Has sufficient cash runway for more than 3 years based on current free cash flows.
- Lack of analyst coverage makes it difficult to determine NUS' earnings prospects.
- Paying a dividend but company is unprofitable.
Looking Ahead:
Although the valuation of a company is important, it shouldn't be the only metric you look at when researching a company. DCF models are not the be-all and end-all of investment valuation. Preferably you'd apply different cases and assumptions and see how they would impact the company's valuation. For example, changes in the company's cost of equity or the risk free rate can significantly impact the valuation. For Nu Skin Enterprises, there are three fundamental aspects you should further research:
- Risks: Case in point, we've spotted 3 warning signs for Nu Skin Enterprises you should be aware of, and 1 of them can't be ignored.
- Management:Have insiders been ramping up their shares to take advantage of the market's sentiment for NUS's future outlook? Check out our management and board analysis with insights on CEO compensation and governance factors.
- Other High Quality Alternatives: Do you like a good all-rounder? Explore our interactive list of high quality stocks to get an idea of what else is out there you may be missing!
PS. Simply Wall St updates its DCF calculation for every American stock every day, so if you want to find the intrinsic value of any other stock just search here.
Have feedback on this article? Concerned about the content? Get in touch with us directly. Alternatively, email editorial-team (at) simplywallst.com.
This article by Simply Wall St is general in nature. We provide commentary based on historical data and analyst forecasts only using an unbiased methodology and our articles are not intended to be financial advice. It does not constitute a recommendation to buy or sell any stock, and does not take account of your objectives, or your financial situation. We aim to bring you long-term focused analysis driven by fundamental data. Note that our analysis may not factor in the latest price-sensitive company announcements or qualitative material. Simply Wall St has no position in any stocks mentioned.
Contact Us
Contact Number : +852 3852 8500Service Email : service@webull.hkBusiness Cooperation : marketinghk@webull.hkWebull Securities Limited is licensed with the Securities and Futures Commission of Hong Kong (CE No. BNG700) for carrying out Type 1 License for Dealing in Securities, Type 2 License for Dealing in Futures Contracts and Type 4 License for Advising on Securities.

English