
What China Tianrui Automotive Interiors Co., LTD's (HKG:6162) 27% Share Price Gain Is Not Telling You
China Tianrui Automotive Interiors Co., LTD (HKG:6162) shareholders would be excited to see that the share price has had a great month, posting a 27% gain and recovering from prior weakness. Looking back a bit further, it's encouraging to see the stock is up 46% in the last year.
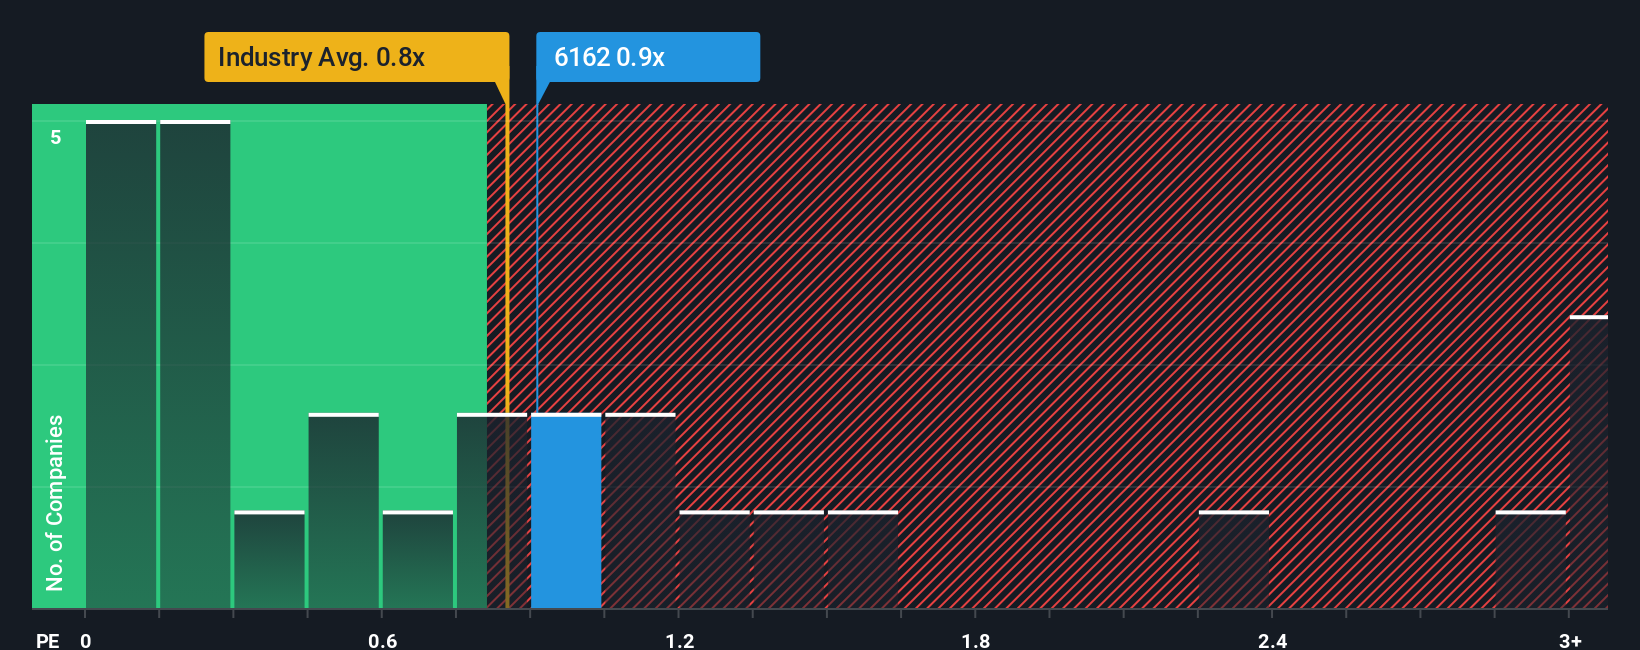
Although its price has surged higher, you could still be forgiven for feeling indifferent about China Tianrui Automotive Interiors' P/S ratio of 0.9x, since the median price-to-sales (or "P/S") ratio for the Auto Components industry in Hong Kong is also close to 0.8x. However, investors might be overlooking a clear opportunity or potential setback if there is no rational basis for the P/S.
Check out our latest analysis for China Tianrui Automotive Interiors
What Does China Tianrui Automotive Interiors' Recent Performance Look Like?
As an illustration, revenue has deteriorated at China Tianrui Automotive Interiors over the last year, which is not ideal at all. Perhaps investors believe the recent revenue performance is enough to keep in line with the industry, which is keeping the P/S from dropping off. If you like the company, you'd at least be hoping this is the case so that you could potentially pick up some stock while it's not quite in favour.
Want the full picture on earnings, revenue and cash flow for the company? Then our free report on China Tianrui Automotive Interiors will help you shine a light on its historical performance.Is There Some Revenue Growth Forecasted For China Tianrui Automotive Interiors?
China Tianrui Automotive Interiors' P/S ratio would be typical for a company that's only expected to deliver moderate growth, and importantly, perform in line with the industry.
In reviewing the last year of financials, we were disheartened to see the company's revenues fell to the tune of 1.2%. This means it has also seen a slide in revenue over the longer-term as revenue is down 18% in total over the last three years. Accordingly, shareholders would have felt downbeat about the medium-term rates of revenue growth.
Comparing that to the industry, which is predicted to deliver 22% growth in the next 12 months, the company's downward momentum based on recent medium-term revenue results is a sobering picture.
With this in mind, we find it worrying that China Tianrui Automotive Interiors' P/S exceeds that of its industry peers. It seems most investors are ignoring the recent poor growth rate and are hoping for a turnaround in the company's business prospects. Only the boldest would assume these prices are sustainable as a continuation of recent revenue trends is likely to weigh on the share price eventually.
What We Can Learn From China Tianrui Automotive Interiors' P/S?
Its shares have lifted substantially and now China Tianrui Automotive Interiors' P/S is back within range of the industry median. It's argued the price-to-sales ratio is an inferior measure of value within certain industries, but it can be a powerful business sentiment indicator.
Our look at China Tianrui Automotive Interiors revealed its shrinking revenues over the medium-term haven't impacted the P/S as much as we anticipated, given the industry is set to grow. When we see revenue heading backwards in the context of growing industry forecasts, it'd make sense to expect a possible share price decline on the horizon, sending the moderate P/S lower. Unless the the circumstances surrounding the recent medium-term improve, it wouldn't be wrong to expect a a difficult period ahead for the company's shareholders.
You should always think about risks. Case in point, we've spotted 4 warning signs for China Tianrui Automotive Interiors you should be aware of, and 1 of them is concerning.
Of course, profitable companies with a history of great earnings growth are generally safer bets. So you may wish to see this free collection of other companies that have reasonable P/E ratios and have grown earnings strongly.
Have feedback on this article? Concerned about the content? Get in touch with us directly. Alternatively, email editorial-team (at) simplywallst.com.
This article by Simply Wall St is general in nature. We provide commentary based on historical data and analyst forecasts only using an unbiased methodology and our articles are not intended to be financial advice. It does not constitute a recommendation to buy or sell any stock, and does not take account of your objectives, or your financial situation. We aim to bring you long-term focused analysis driven by fundamental data. Note that our analysis may not factor in the latest price-sensitive company announcements or qualitative material. Simply Wall St has no position in any stocks mentioned.
Contact Us
Contact Number : +852 3852 8500Service Email : service@webull.hkBusiness Cooperation : marketinghk@webull.hkWebull Securities Limited is licensed with the Securities and Futures Commission of Hong Kong (CE No. BNG700) for carrying out Type 1 License for Dealing in Securities, Type 2 License for Dealing in Futures Contracts and Type 4 License for Advising on Securities.

English