
Global Penny Stocks To Watch In July 2025
Global markets have recently been buoyed by a series of favorable trade deals, propelling major indices like the S&P 500 and Nasdaq Composite to record highs. In this context of economic optimism, investors may find opportunities in penny stocks—a term that might seem outdated but still signifies potential growth avenues in the market. These stocks often represent smaller or newer companies that can offer affordability and growth prospects when supported by strong financials, making them an intriguing option for those seeking under-the-radar investment opportunities.
Top 10 Penny Stocks Globally
| Name | Share Price | Market Cap | Rewards & Risks |
| EZZ Life Science Holdings (ASX:EZZ) | A$2.16 | A$102.84M | ✅ 4 ⚠️ 2 View Analysis > |
| Lever Style (SEHK:1346) | HK$1.48 | HK$933.81M | ✅ 4 ⚠️ 1 View Analysis > |
| Angler Gaming (NGM:ANGL) | SEK3.60 | SEK269.95M | ✅ 4 ⚠️ 2 View Analysis > |
| CNMC Goldmine Holdings (Catalist:5TP) | SGD0.49 | SGD198.59M | ✅ 4 ⚠️ 1 View Analysis > |
| MGB Berhad (KLSE:MGB) | MYR0.51 | MYR301.74M | ✅ 5 ⚠️ 2 View Analysis > |
| Yangzijiang Shipbuilding (Holdings) (SGX:BS6) | SGD2.53 | SGD9.96B | ✅ 5 ⚠️ 0 View Analysis > |
| DXN Holdings Bhd (KLSE:DXN) | MYR0.505 | MYR2.51B | ✅ 5 ⚠️ 0 View Analysis > |
| Zetrix AI Berhad (KLSE:ZETRIX) | MYR0.845 | MYR6.5B | ✅ 5 ⚠️ 2 View Analysis > |
| SKP Resources Bhd (KLSE:SKPRES) | MYR0.915 | MYR1.43B | ✅ 5 ⚠️ 1 View Analysis > |
| Begbies Traynor Group (AIM:BEG) | £1.21 | £192.55M | ✅ 4 ⚠️ 2 View Analysis > |
Click here to see the full list of 3,828 stocks from our Global Penny Stocks screener.
Underneath we present a selection of stocks filtered out by our screen.
Shenghua Lande Scitech (SEHK:8106)
Simply Wall St Financial Health Rating: ★★★★☆☆
Overview: Shenghua Lande Scitech Limited is an investment holding company that trades in hardware and computer software in the People’s Republic of China, with a market cap of HK$192.49 million.
Operations: The company's revenue is primarily derived from trading hardware and computer software, amounting to CN¥165.30 million, with an additional CN¥19.75 million generated from the provision of smart city solutions.
Market Cap: HK$192.49M
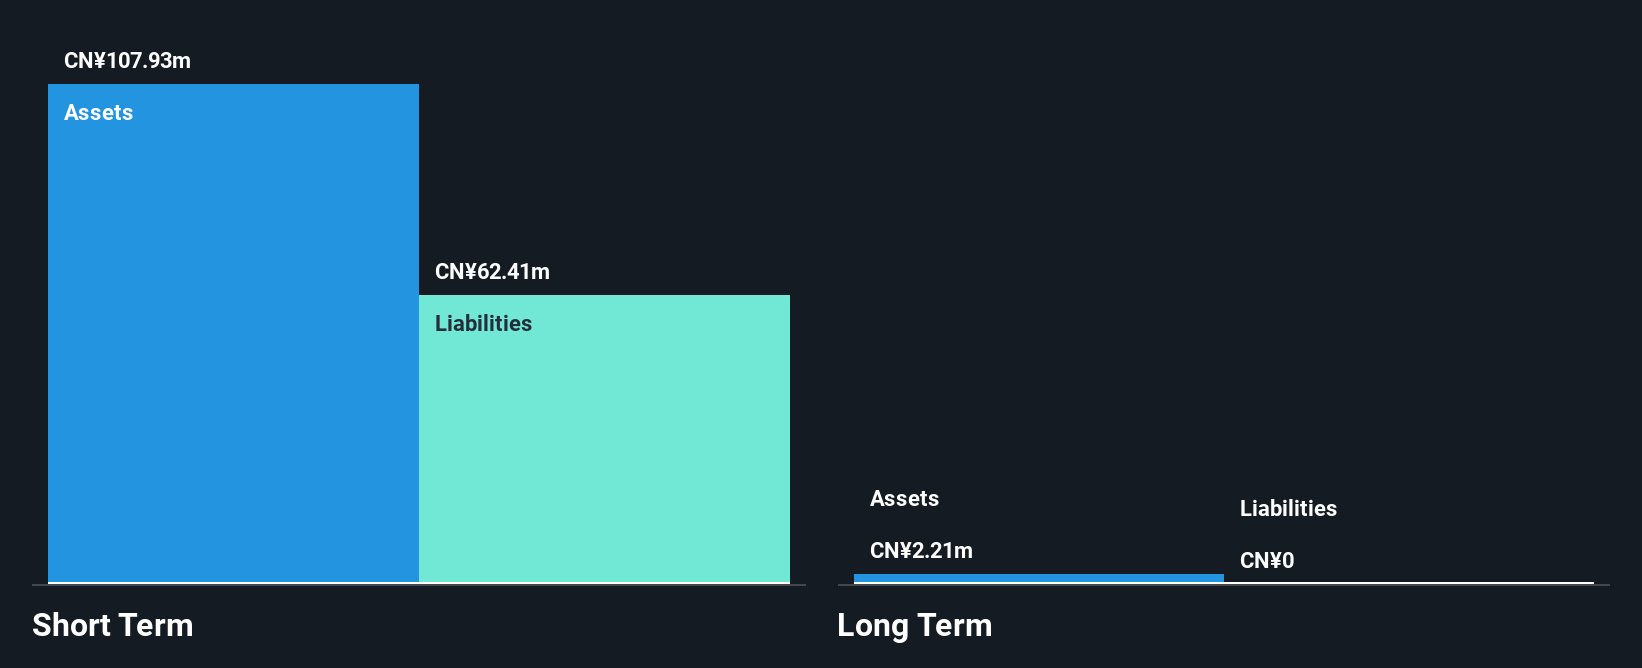
Shenghua Lande Scitech Limited, with a market cap of HK$192.49 million, primarily generates revenue from trading hardware and software in China. The company faces challenges with increased volatility, currently at 53%, and remains unprofitable with declining earnings over the past five years. However, its short-term assets exceed liabilities significantly, providing some financial stability despite having less than a year of cash runway if free cash flow continues to decline. Recent M&A transactions indicate significant shareholder changes but could potentially stabilize ownership structure without impacting its principal business operations or stock exchange listing status.
- Click here and access our complete financial health analysis report to understand the dynamics of Shenghua Lande Scitech.
- Gain insights into Shenghua Lande Scitech's historical outcomes by reviewing our past performance report.
Frencken Group (SGX:E28)
Simply Wall St Financial Health Rating: ★★★★★☆
Overview: Frencken Group Limited is an investment holding company that offers original design, original equipment, and diversified integrated manufacturing solutions globally, with a market cap of SGD726.05 million.
Operations: The company's revenue is primarily derived from its Mechatronics segment, which generated SGD706.09 million, and its Integrated Manufacturing Services (IMS) segment, contributing SGD85.68 million.
Market Cap: SGD726.05M
Frencken Group, with a market cap of SGD726.05 million, demonstrates financial stability through its substantial short-term assets of SGD539.8 million, which exceed both its short and long-term liabilities. The company is trading at 51.7% below estimated fair value and maintains high-quality earnings with more cash than total debt, ensuring debt levels are well covered by operating cash flow (55.5%). Despite an increase in the debt-to-equity ratio over five years, interest payments are well covered by EBIT (8x coverage). Earnings growth accelerated to 14.3% last year, though it remains lower than the industry average of 29.5%.
- Click to explore a detailed breakdown of our findings in Frencken Group's financial health report.
- Examine Frencken Group's earnings growth report to understand how analysts expect it to perform.
UOB-Kay Hian Holdings (SGX:U10)
Simply Wall St Financial Health Rating: ★★★★☆☆
Overview: UOB-Kay Hian Holdings Limited is an investment holding company offering services such as stockbroking, futures broking, structured lending, investment trading, margin financing, and research services with a market capitalization of SGD2.38 billion.
Operations: The company generates revenue of SGD631.69 million from its securities and futures broking and related services segment.
Market Cap: SGD2.38B
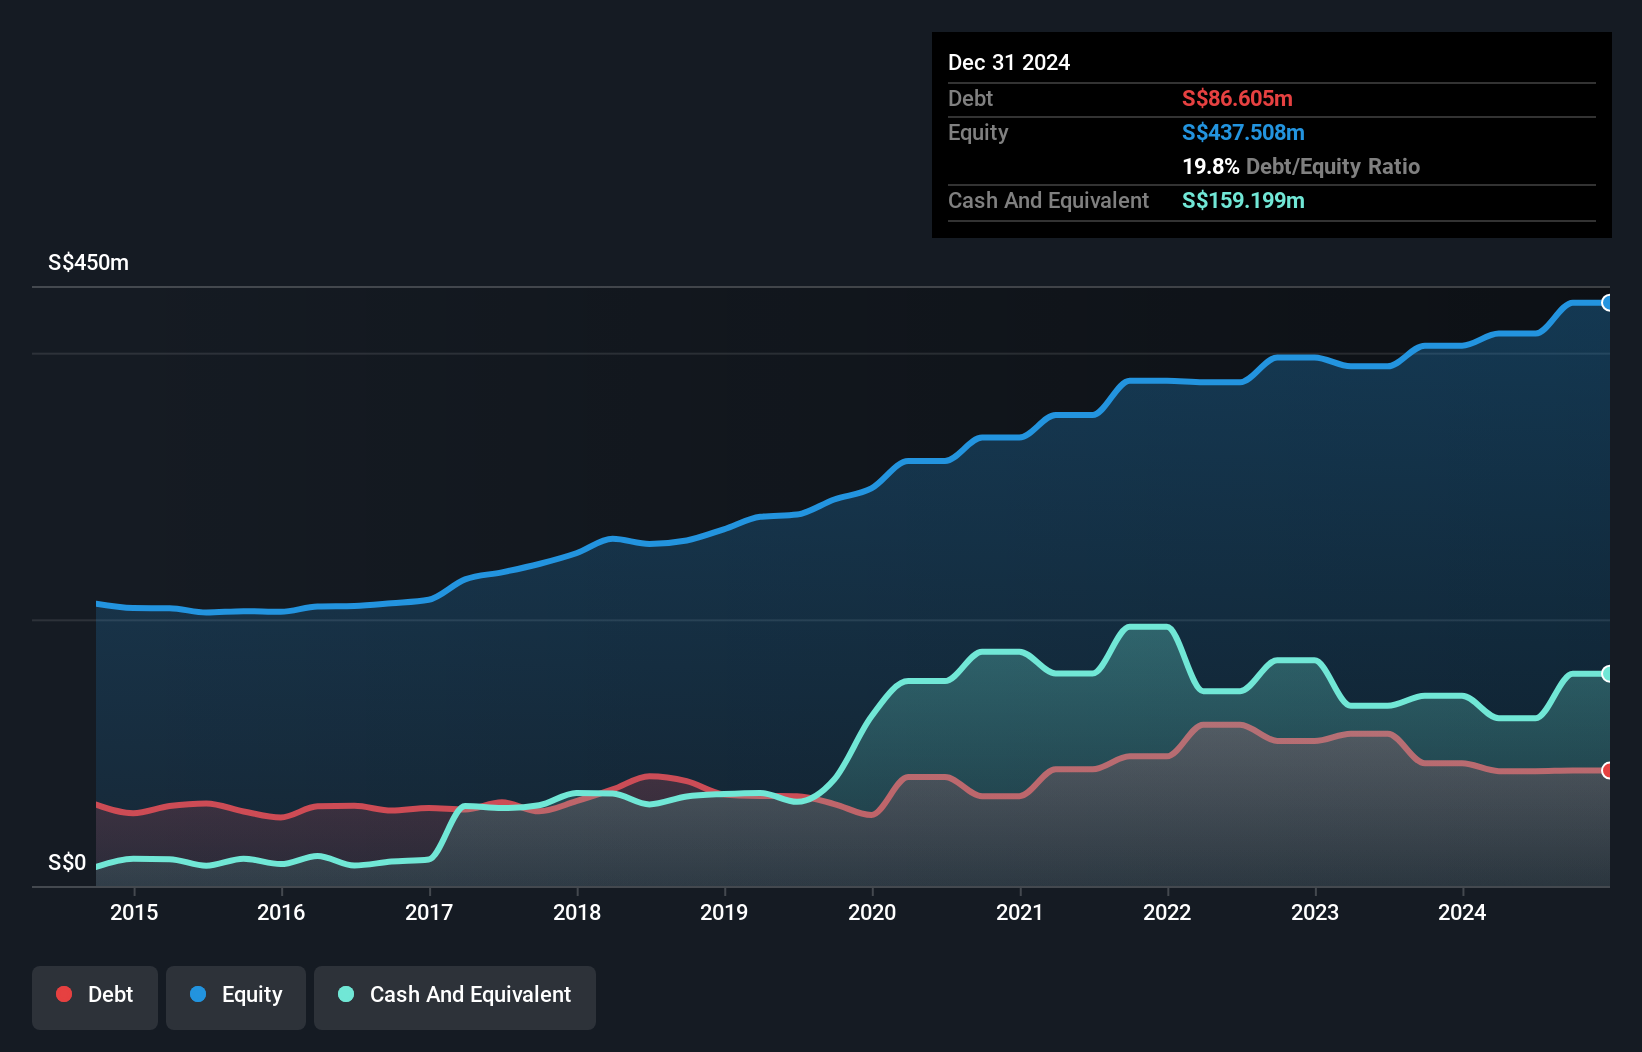
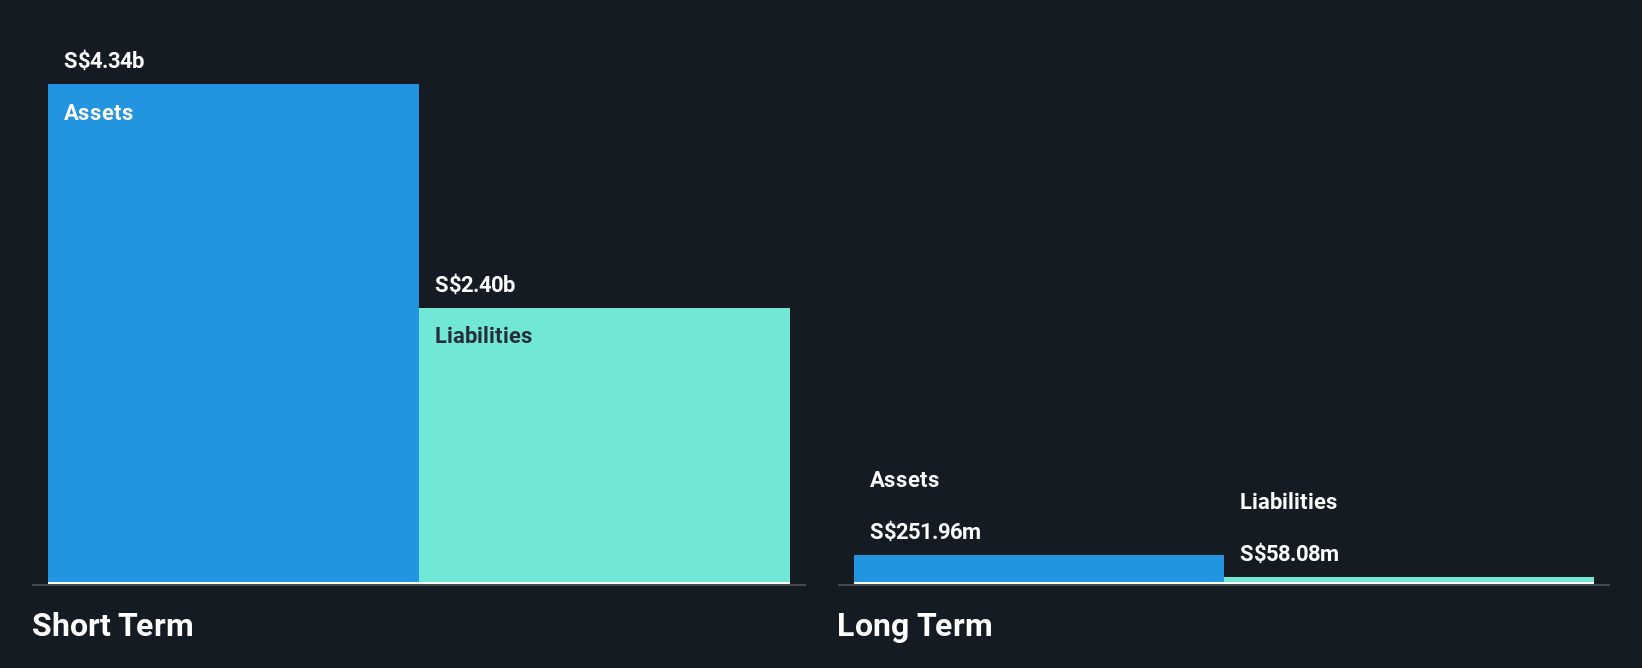
UOB-Kay Hian Holdings, with a market cap of SGD2.38 billion, exhibits financial strength through its significant short-term assets (SGD4.3 billion) surpassing both short and long-term liabilities. The company has reduced its debt-to-equity ratio from 75% to 43.8% over five years and maintains a price-to-earnings ratio of 10.6x, below the SG market average of 13.7x, indicating potential value for investors seeking penny stocks with growth prospects. However, the dividend yield of 4.88% is not well covered by free cash flows, and recent board changes suggest evolving corporate governance dynamics amidst experienced board leadership averaging over four years in tenure.
- Jump into the full analysis health report here for a deeper understanding of UOB-Kay Hian Holdings.
- Gain insights into UOB-Kay Hian Holdings' past trends and performance with our report on the company's historical track record.
Next Steps
- Unlock our comprehensive list of 3,828 Global Penny Stocks by clicking here.
- Looking For Alternative Opportunities? Find companies with promising cash flow potential yet trading below their fair value.
This article by Simply Wall St is general in nature. We provide commentary based on historical data and analyst forecasts only using an unbiased methodology and our articles are not intended to be financial advice. It does not constitute a recommendation to buy or sell any stock, and does not take account of your objectives, or your financial situation. We aim to bring you long-term focused analysis driven by fundamental data. Note that our analysis may not factor in the latest price-sensitive company announcements or qualitative material. Simply Wall St has no position in any stocks mentioned.
Have feedback on this article? Concerned about the content? Get in touch with us directly. Alternatively, email editorial-team@simplywallst.com
Contact Us
Contact Number : +852 3852 8500Service Email : service@webull.hkBusiness Cooperation : marketinghk@webull.hkWebull Securities Limited is licensed with the Securities and Futures Commission of Hong Kong (CE No. BNG700) for carrying out Type 1 License for Dealing in Securities, Type 2 License for Dealing in Futures Contracts and Type 4 License for Advising on Securities.

English