
Carry Wealth Holdings Leads The Charge In Asian Penny Stocks
Amidst a backdrop of global economic uncertainty, Asian markets have been navigating the complexities of trade tensions and fluctuating economic data. In such times, investors often look beyond established giants to explore opportunities in smaller or newer companies, sometimes referred to as penny stocks. Although the term may seem outdated, these stocks can still present valuable opportunities when backed by strong financials and growth potential. This article explores three Asian penny stocks that stand out for their balance sheet resilience and potential for significant returns.
Top 10 Penny Stocks In Asia
| Name | Share Price | Market Cap | Rewards & Risks |
| Food Moments (SET:FM) | THB4.10 | THB4.05B | ✅ 4 ⚠️ 0 View Analysis > |
| Lever Style (SEHK:1346) | HK$1.48 | HK$933.81M | ✅ 4 ⚠️ 1 View Analysis > |
| TK Group (Holdings) (SEHK:2283) | HK$2.39 | HK$1.99B | ✅ 3 ⚠️ 1 View Analysis > |
| CNMC Goldmine Holdings (Catalist:5TP) | SGD0.515 | SGD208.72M | ✅ 4 ⚠️ 1 View Analysis > |
| T.A.C. Consumer (SET:TACC) | THB4.66 | THB2.8B | ✅ 3 ⚠️ 3 View Analysis > |
| China Sunsine Chemical Holdings (SGX:QES) | SGD0.73 | SGD695.97M | ✅ 4 ⚠️ 1 View Analysis > |
| Yangzijiang Shipbuilding (Holdings) (SGX:BS6) | SGD2.53 | SGD9.96B | ✅ 5 ⚠️ 0 View Analysis > |
| Livestock Improvement (NZSE:LIC) | NZ$1.00 | NZ$142.34M | ✅ 2 ⚠️ 5 View Analysis > |
| Rojana Industrial Park (SET:ROJNA) | THB4.70 | THB9.5B | ✅ 3 ⚠️ 3 View Analysis > |
| BRC Asia (SGX:BEC) | SGD3.57 | SGD979.43M | ✅ 4 ⚠️ 1 View Analysis > |
Click here to see the full list of 987 stocks from our Asian Penny Stocks screener.
Let's review some notable picks from our screened stocks.
Carry Wealth Holdings (SEHK:643)
Simply Wall St Financial Health Rating: ★★★★★★
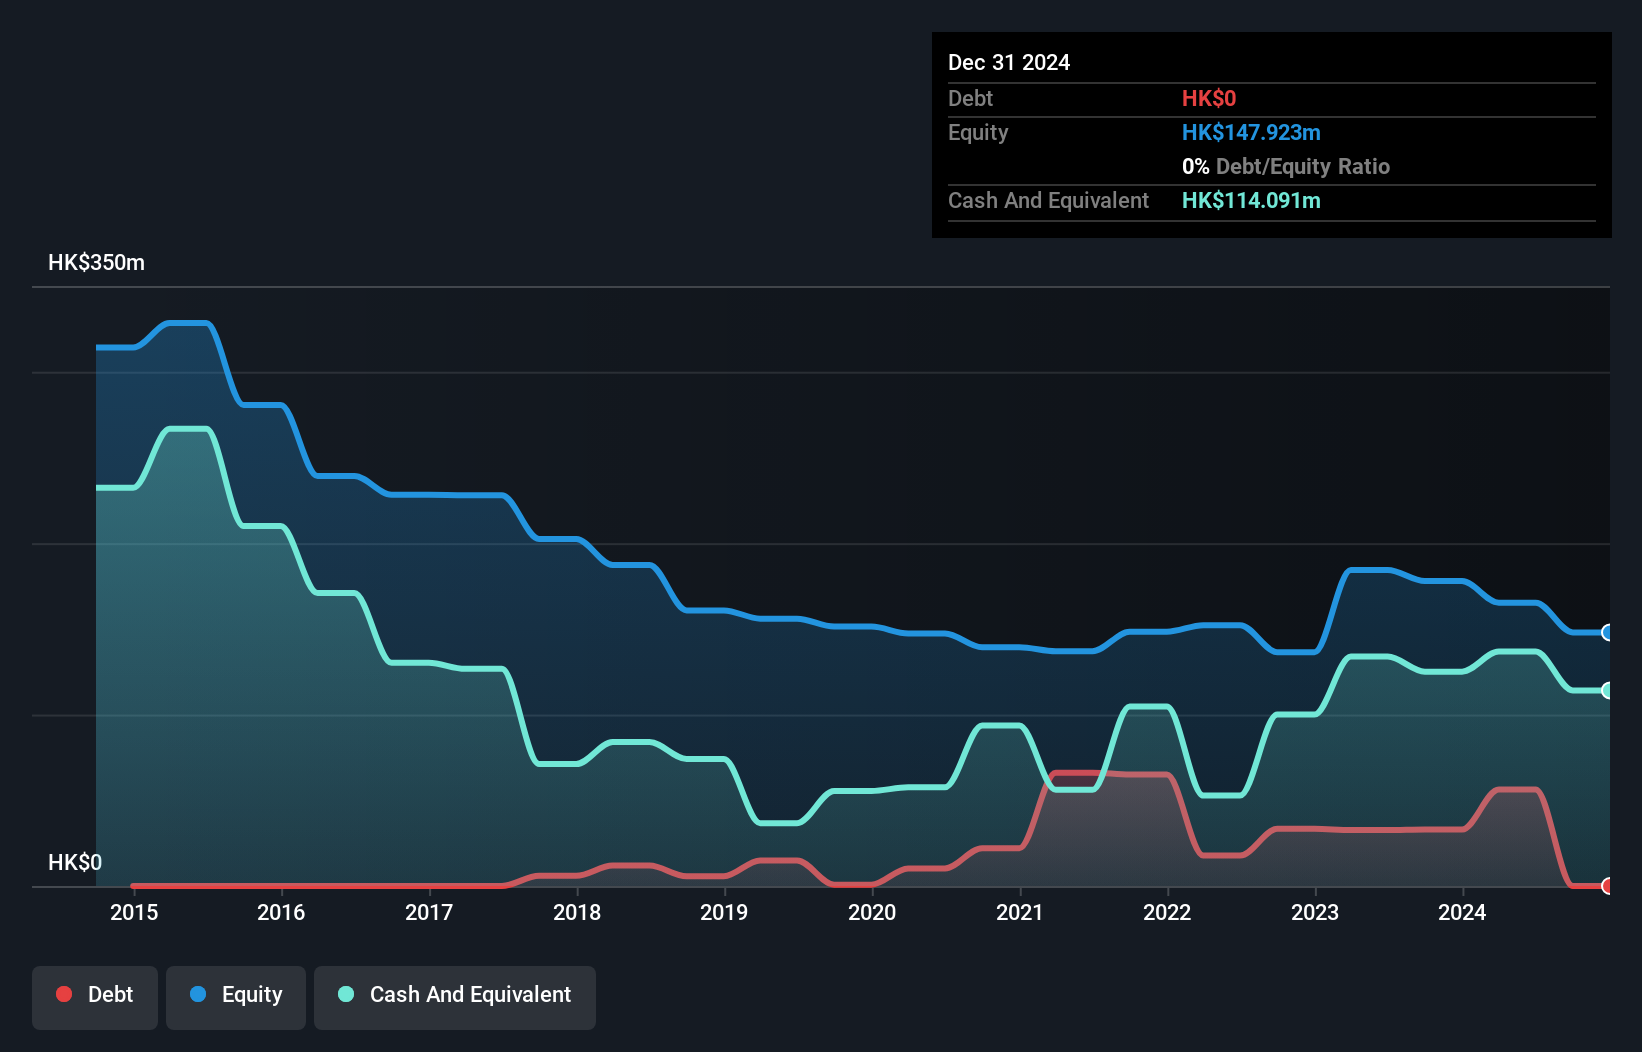
Overview: Carry Wealth Holdings Limited is an investment holding company that manufactures, trades, and markets garment products for various brands across the United States, Mainland China, Europe, Hong Kong, and internationally with a market cap of HK$431.93 million.
Operations: The company's revenue is primarily derived from its Garment Manufacturing and Trading segment, which generated HK$664.69 million.
Market Cap: HK$431.93M
Carry Wealth Holdings Limited, with a market cap of HK$431.93 million, primarily generates revenue from its Garment Manufacturing and Trading segment. Despite being unprofitable, the company is debt-free and maintains a strong cash runway exceeding three years based on current free cash flow. Recent board changes introduced experienced financial professionals, potentially strengthening oversight. However, high share price volatility persists alongside negative return on equity at -22.85%. While short-term assets comfortably cover liabilities, both management and board tenures are relatively short, indicating an evolving leadership team as the company navigates its challenges in the competitive garment industry.
- Jump into the full analysis health report here for a deeper understanding of Carry Wealth Holdings.
- Review our historical performance report to gain insights into Carry Wealth Holdings' track record.
Qinghai Spring Medicinal Resources Technology (SHSE:600381)
Simply Wall St Financial Health Rating: ★★★★★★
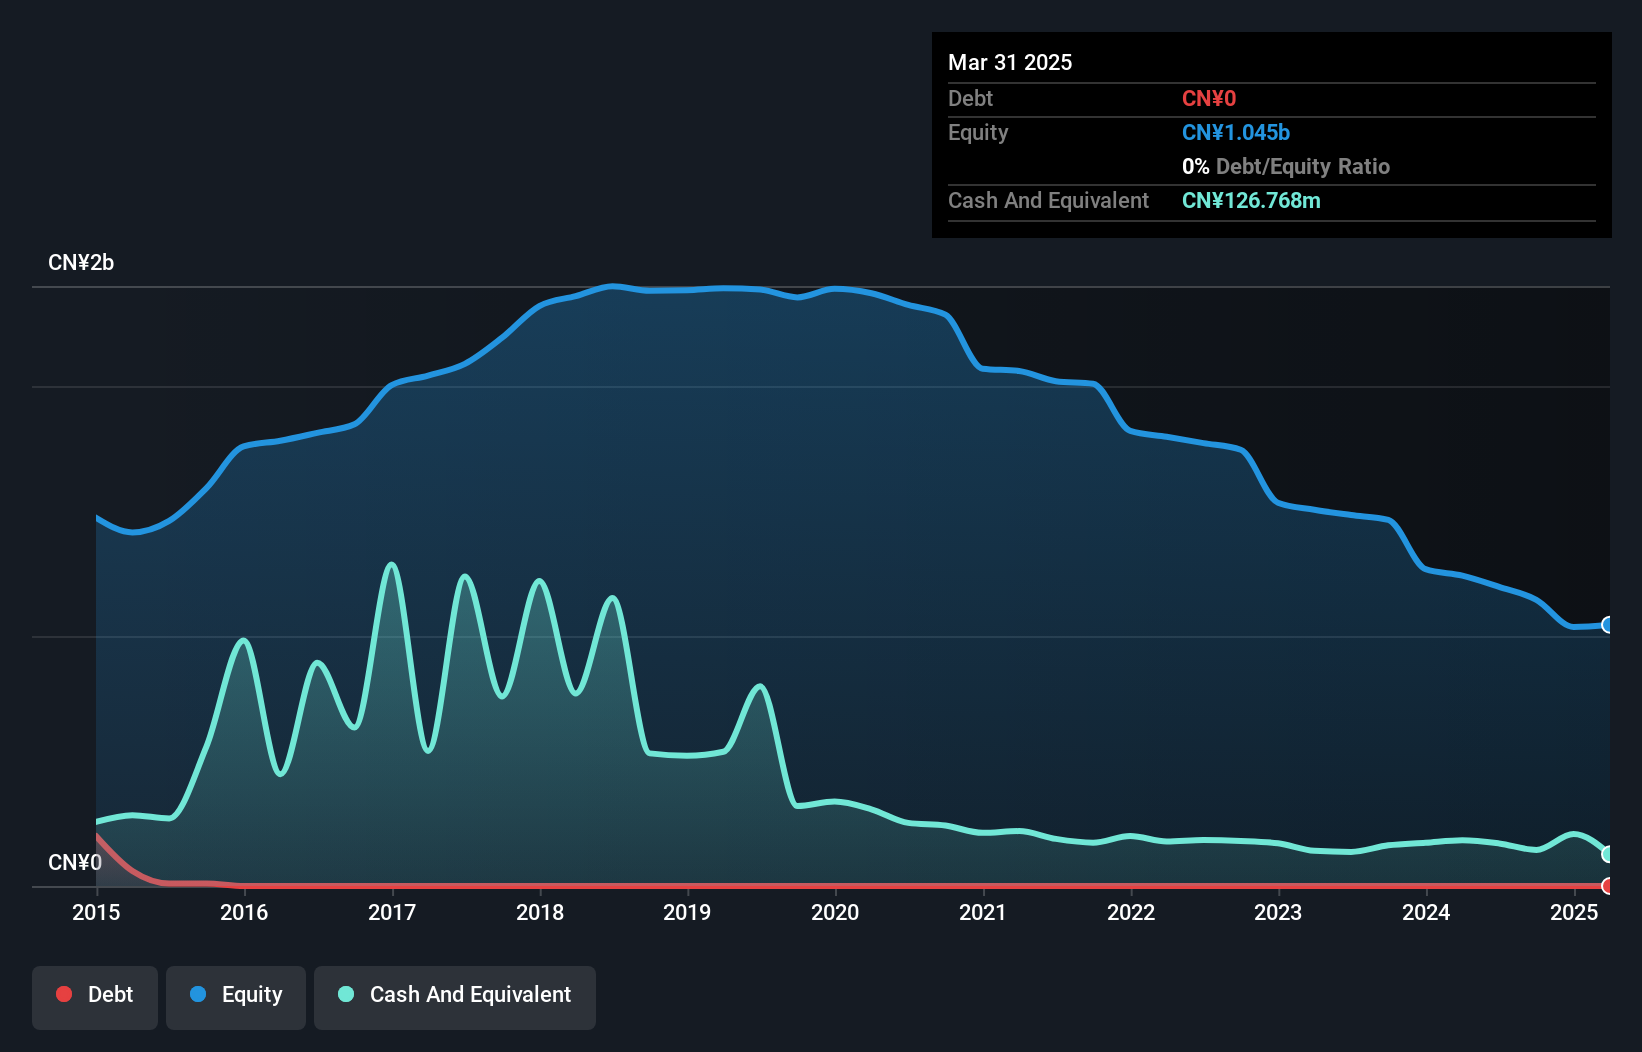
Overview: Qinghai Spring Medicinal Resources Technology Co., Ltd. operates in the medicinal resources sector and has a market cap of approximately CN¥25.01 billion.
Operations: Qinghai Spring Medicinal Resources Technology Co., Ltd. has not reported specific revenue segments.
Market Cap: CN¥2.5B
Qinghai Spring Medicinal Resources Technology, with a market cap of CN¥25.01 billion, operates without significant revenue streams, indicating it may be pre-revenue. The company is debt-free and possesses a robust cash runway exceeding three years based on current free cash flow. Despite its unprofitability and negative return on equity at -15.54%, the management team and board are experienced, averaging tenures of 10.4 and 5.7 years respectively. Short-term assets significantly exceed liabilities, providing financial stability amidst challenges in achieving profitability as earnings have declined by 8.5% annually over the past five years.
- Navigate through the intricacies of Qinghai Spring Medicinal Resources Technology with our comprehensive balance sheet health report here.
- Learn about Qinghai Spring Medicinal Resources Technology's historical performance here.
Zhejiang CONBA PharmaceuticalLtd (SHSE:600572)
Simply Wall St Financial Health Rating: ★★★★★★
Overview: Zhejiang CONBA Pharmaceutical Co., Ltd. focuses on the research, development, production, and sales of pharmaceuticals and health products in mainland China, with a market cap of CN¥11.53 billion.
Operations: The company's revenue is primarily generated from its operations in China, amounting to CN¥6.38 billion.
Market Cap: CN¥11.53B
Zhejiang CONBA Pharmaceutical Co., Ltd. has shown financial resilience with a significant reduction in its debt to equity ratio from 63.8% to 3.9% over five years, and its short-term assets of CN¥4.5 billion comfortably cover both short and long-term liabilities. Despite a low return on equity at 8.7%, the company has maintained stable earnings growth, surpassing industry averages with a recent annual increase of 13.8%. However, its dividend track record remains unstable, and the board's average tenure of 1.6 years suggests limited experience in navigating market complexities effectively.
- Click here to discover the nuances of Zhejiang CONBA PharmaceuticalLtd with our detailed analytical financial health report.
- Assess Zhejiang CONBA PharmaceuticalLtd's previous results with our detailed historical performance reports.

Make It Happen
- Explore the 987 names from our Asian Penny Stocks screener here.
- Curious About Other Options? Rare earth metals are the new gold rush. Find out which 25 stocks are leading the charge.
This article by Simply Wall St is general in nature. We provide commentary based on historical data and analyst forecasts only using an unbiased methodology and our articles are not intended to be financial advice. It does not constitute a recommendation to buy or sell any stock, and does not take account of your objectives, or your financial situation. We aim to bring you long-term focused analysis driven by fundamental data. Note that our analysis may not factor in the latest price-sensitive company announcements or qualitative material. Simply Wall St has no position in any stocks mentioned.
Have feedback on this article? Concerned about the content? Get in touch with us directly. Alternatively, email editorial-team@simplywallst.com
Contact Us
Contact Number : +852 3852 8500Webull Securities Limited is licensed with the Securities and Futures Commission of Hong Kong (CE No. BNG700) for carrying out Type 1 License for Dealing in Securities, Type 2 License for Dealing in Futures Contracts and Type 4 License for Advising on Securities.

English