Axon Tops Q2 Earnings & Revenue Estimates, Raises 2025 Guidance
Axon Enterprise, Inc. AXON reported second-quarter 2025 adjusted earnings of $2.12 per share, which surpassed the Zacks Consensus Estimate of $1.54. The bottom line surged 73.8% year over year despite a rise in the cost of sales.
Total revenues of $668.5 million surpassed the consensus estimate of $643 million and increased 33% year over year. The top line benefited from strong demand for TASER 10, Axon Body 4 and counter-drone equipment. Growing adoption of premium software solutions also augmented the top-line results.
AXON’s Q2 Business Segment Performance
Effective first-quarter 2025, AXON realigned its business segments. The company now reports results under two business segments, namely Connected Devices and Software & Services.
Connected Devices: The segment’s revenues jumped 28.6% year over year to $376.4 million, driven by increase in demand for TASER 10 devices and associated cartridges, and Axon Body 4 as well as growth in platform solutions. The adjusted gross margin decreased year over year to 51.1% from 53.4%. The Zacks Consensus Estimate for Connected Devices’ revenues was pegged at $366 million.
Software & Services: The segment’s revenues rose 38.8% year over year to $292.2 million. The uptick was driven by an increase in the aggregate number of users and growing adoption of premium software offerings. The adjusted gross margin increased to 78.9% from 76. 6% in the year-ago period due to a higher software mix. The Zacks Consensus Estimate for Software & Services’ revenues was pegged at $284 million.
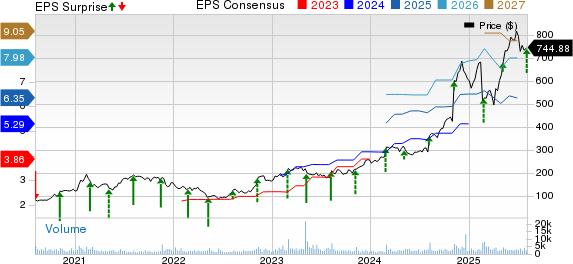
Axon Enterprise, Inc Price, Consensus and EPS Surprise
Axon Enterprise, Inc price-consensus-eps-surprise-chart | Axon Enterprise, Inc Quote
AXON’s Margin Profile
Axon’s cost of sales increased 11.3% year over year to $264.8 million. Selling, general and administrative expenses increased 8.4% year over year to $242.2 million.
Total operating expenses climbed 8.1% year over year to $404.8 million. The adjusted gross margin increased to 63.3% from 63.1% in the year-ago period.
AXON’s Balance Sheet & Cash Flow
At the end of second-quarter 2025, Axon had cash and cash equivalents of $615.5 million compared with $454.8 million at December 2024-end. Long-term lease liabilities totaled $43.6 million compared with $41.4 million at 2024-end.
In the first six months of 2025, the company used net cash of $65.9 million from operating activities against $66.8 million in cash generated in the previous year period.
Adjusted free cash flow was a negative $113.7 million in the first six months of 2025 compared with $39.3 million in the prior-year period.
AXON’s Outlook for 2025
For 2025, Axon expects revenues to be in the band of $2.65-$2.73 billion compared with $2.60-$2.70 billion anticipated earlier. The metric indicates approximately 29% year-over-year growth at the midpoint. Adjusted EBITDA is expected to be in the range of $665-$685 million, implying an adjusted EBITDA margin of about 25%.
The company expects capital expenditures to be between $170 million and $185 million. This includes investments in long-term research & development projects, continued capacity expansion, global facility build-outs and new product development. It anticipates stock-based compensation expenses to be in the range of $580-$630 million.
AXON’s Zacks Rank & Other Key Picks
The company currently sports a Zacks Rank #1 (Strong Buy). You can see the complete list of today’s Zacks #1 Rank stocks here.
Some other top-ranked companies are discussed below:
TransDigm Group Incorporated TDG presently carries a Zacks Rank #2 (Buy). TDG’s earnings surpassed the consensus estimate in each of the trailing four quarters. The average earnings surprise was 5.1%. In the past 60 days, the Zacks Consensus Estimate for Transdigm’s 2025 earnings has inched up 0.2%.
Woodward, Inc. WWD currently carries a Zacks Rank of 2. WWD has an impressive earnings surprise history, having outperformed the consensus estimate in each of the preceding four quarters, the average surprise being 15%. In the past 60 days, the Zacks Consensus Estimate for Woodward’s fiscal 2025 (ending September 2025) earnings has increased 3.4%.
HEICO Corporation HEI currently carries a Zacks Rank of 2. HEI outperformed the consensus estimate in each of the preceding four quarters, with an average surprise of 11.9%. In the past 60 days, the Zacks Consensus Estimate for HEICO’s 2025 earnings has increased 2%.
Only $1 to See All Zacks' Buys and Sells
We're not kidding.
Several years ago, we shocked our members by offering them 30-day access to all our picks for the total sum of only $1. No obligation to spend another cent. Thousands have taken advantage of this opportunity.
Thousands did not - they thought there must be a catch. Yes, we do have a reason. We want you to get acquainted with our portfolio services like Surprise Trader, Stocks Under $10, Technology Innovators, and more, that closed 256 positions with double- and triple-digit gains in 2024 alone.
See Stocks Now >>Want the latest recommendations from Zacks Investment Research? Today, you can download 7 Best Stocks for the Next 30 Days. Click to get this free report
Transdigm Group Incorporated (TDG): Free Stock Analysis Report
Woodward, Inc. (WWD): Free Stock Analysis Report
Heico Corporation (HEI): Free Stock Analysis Report
Axon Enterprise, Inc (AXON): Free Stock Analysis Report
This article originally published on Zacks Investment Research (zacks.com).
Contact Us
Contact Number : +852 3852 8500Service Email : service@webull.hkBusiness Cooperation : marketinghk@webull.hkWebull Securities Limited is licensed with the Securities and Futures Commission of Hong Kong (CE No. BNG700) for carrying out Type 1 License for Dealing in Securities, Type 2 License for Dealing in Futures Contracts and Type 4 License for Advising on Securities.

English