
Schwab Witnesses Rise in July 2025 Client Assets: What's Behind it?
For July 2025, Charles Schwab SCHW recorded an increase in client assets. Total client assets at month end were $10.96 trillion, up 15% from July 2024 and 2% from June 2025. Client assets receiving ongoing advisory services were $5.51 trillion, growing 2% from the year-ago period and 14% from the previous month.
Core net new assets of $46.9 billion increased 62% from the prior-year month and 10% from June 2025.
Schwab continues to benefit from heightened market volatility. Its recent performance has reflected strong asset gathering, sustained client engagement and equity market appreciation. Despite the company lowering fees on certain investing solution products, revenues from the same have been increasing, given the rise in average client assets. The brokerage firm reported a year-over-year rise in trading revenues in the first half of 2025.
In the past five years (ended 2024), Schwab’s total client assets saw a compound annual growth rate (CAGR) of 20.1%, with the uptrend continuing in the first six months of 2025. This was primarily driven by acquisitions completed during this period and market appreciation. Moreover, Schwab’s continued efforts to increase its client base in advisory solutions have been bearing fruit. Its total managed investing solutions revenues witnessed a CAGR of 12.2% over the same time frame.
Schwab’s inorganic expansion efforts amid favorable market conditions will continue to drive client asset growth, which will aid the top line. The Zacks Consensus Estimate for SCHW’s 2025 revenues is $23.41 billion, which suggests a year-over-year rise of 19.4%.
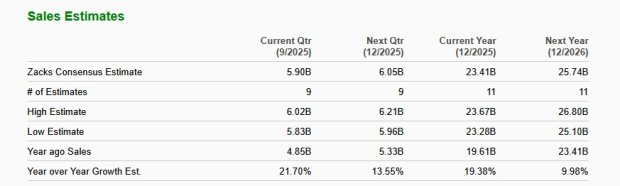
Image Source: Zacks Investment Research
Additional Data From Schwab’s July Activity
SCHW’s average interest-earning assets at the end of July were $418.6 billion, which rose marginally from July 2024 and June 2025. Average margin balances were $85.5 billion, up 17% from the year-ago month and 4% from June 2025. Average bank deposit account balances totaled $80.8 billion, down 4% from the prior-year month and marginally from the last month.
Schwab opened 377,000 new brokerage accounts in July 2025, up 15% from the year-earlier month and 17% from the previous month.
SCHW’s active brokerage accounts totaled 37.7 million, up 5% year over year and marginally from June 2025. Client banking accounts were 2.1 million, up 9% from the July 2024 level and 1% sequentially. The number of workplace plan participant accounts was up 4% year over year and 1% sequentially to 5.6 million.
Schwab’s Competitive Landscape
SCHW’s close competitor Robinhood Markets, Inc. HOOD reported an increase in equity, options and crypto Daily Average Revenue Trades (DARTs) in July. Equity DARTs were 2.7 million, up 29% from the prior-year quarter. Options DARTs rose 22% year over year to 1.1 million, while crypto DARTs soared 133% to 0.7 million.
The data reflect that Robinhood’s efforts to become a leader in the active trader market have started bearing fruit. Robinhood has been diversifying its offerings to capitalize on investor demands and expand into lucrative businesses.
Likewise, Interactive Brokers IBKR reported a year-over-year rise in client DARTs in July 2025. Total client DARTs were 3,498,000, representing a 27% increase from July 2024 and a 1% rise from June 2025.
Interactive Brokers has been continuously making efforts to develop proprietary software to automate broker-dealer functions, and expand its product suite and reach of its services. Given the solid DART numbers and a robust trading backdrop, Interactive Brokers’ revenues are expected to improve in the quarters ahead.
SCHW’s Price Performance, Valuation & Estimate Analysis
Shares of Schwab have rallied 29.9% so far this year compared with the industry’s rise of 20.8%.
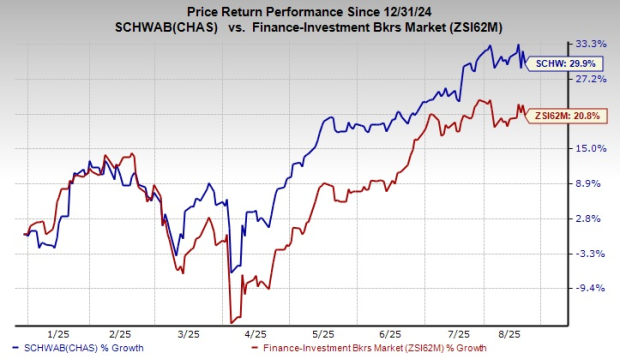
Image Source: Zacks Investment Research
From a valuation standpoint, SCHW trades at a forward price-to-earnings (P/E) ratio of 18.72, above the industry average.
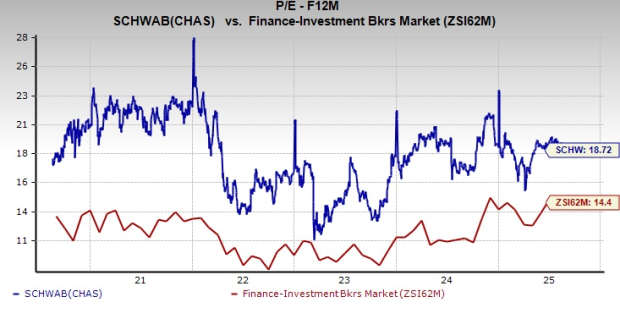
Image Source: Zacks Investment Research
The Zacks Consensus Estimate for Schwab’s 2025 and 2026 earnings indicates year-over-year growth of 42.5% and 17.3%, respectively. Over the past 30 days, earnings estimates for both years have been revised upward.
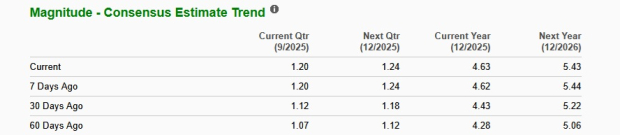
Image Source: Zacks Investment Research
Currently, Schwab carries a Zacks Rank #2 (Buy). You can see the complete list of today’s Zacks #1 Rank (Strong Buy) stocks here.
Free Report: Profiting from the 2nd Wave of AI Explosion
The next phase of the AI explosion is poised to create significant wealth for investors, especially those who get in early. It will add literally trillion of dollars to the economy and revolutionize nearly every part of our lives.
Investors who bought shares like Nvidia at the right time have had a shot at huge gains.
But the rocket ride in the "first wave" of AI stocks may soon come to an end. The sharp upward trajectory of these stocks will begin to level off, leaving exponential growth to a new wave of cutting-edge companies.
Zacks' AI Boom 2.0: The Second Wave report reveals 4 under-the-radar companies that may soon be shining stars of AI’s next leap forward.
Access AI Boom 2.0 now, absolutely free >>Want the latest recommendations from Zacks Investment Research? Today, you can download 7 Best Stocks for the Next 30 Days. Click to get this free report
The Charles Schwab Corporation (SCHW): Free Stock Analysis Report
Interactive Brokers Group, Inc. (IBKR): Free Stock Analysis Report
Robinhood Markets, Inc. (HOOD): Free Stock Analysis Report
This article originally published on Zacks Investment Research (zacks.com).
Contact Us
Contact Number : +852 3852 8500Service Email : service@webull.hkBusiness Cooperation : marketinghk@webull.hkWebull Securities Limited is licensed with the Securities and Futures Commission of Hong Kong (CE No. BNG700) for carrying out Type 1 License for Dealing in Securities, Type 2 License for Dealing in Futures Contracts and Type 4 License for Advising on Securities.

English