
Is e.l.f. Beauty at a Turning Point After Double Digit Growth and Share Price Drop?
Thinking about what to do with e.l.f. Beauty stock these days? You are not alone. With shares currently trading around $119.83, many investors are weighing up whether this popular beauty brand is just getting started or approaching its peak. The stock’s performance paints an intriguing picture. Although e.l.f. Beauty has pulled back roughly 2.6% year-to-date and posted a one-year total return of -25.7%, the long-term story is hard to ignore. Over the past three and five years, shares have skyrocketed by 220% and 517% respectively. That kind of multiyear surge tends to catch the market’s eye and shift risk perceptions, especially following news of continued double-digit growth in both revenue and net income.
Still, rapid success often triggers skepticism. Investors are now scrutinizing whether the company’s valuation still makes sense, particularly as analysts are setting their price target over 11% above today’s level. Intrinsic models are suggesting a notable discount of 46.3%. By our tally, e.l.f. Beauty scores a 2 out of 6 on key valuation checks, which means it comes up undervalued in just two categories. This is a signal for further investigation rather than a guaranteed opportunity. In the next section, we will walk through the different ways to look at valuation. Stay tuned, as we will also share a more insightful lens for understanding what e.l.f. Beauty might really be worth.
e.l.f. Beauty delivered -25.7% returns over the last year. See how this stacks up to the rest of the Personal Products industry.Approach 1: e.l.f. Beauty Cash Flows
A Discounted Cash Flow (DCF) model helps estimate the fair value of a stock by projecting a company’s future cash flows and then discounting them back to today’s dollars. The idea is simple, even if the math is meticulous: if you can reasonably estimate how much cash a business will generate and what that is worth today, you have a powerful measure of what to pay for its shares.
For e.l.f. Beauty, the latest twelve months’ Free Cash Flow stands at $144.54 million. Analysts expect this to ramp up rapidly. By 2028, forecasted annual free cash flow is projected to reach $401 million, with estimates climbing to approximately $905 million by 2035. These numbers reflect strong optimism about sustained multiyear growth.
Using these cash flow projections in a 2 Stage Free Cash Flow to Equity model, the DCF analysis suggests an intrinsic fair value of $223.08 per share. This is nearly double today’s share price and equates to e.l.f. Beauty trading at a 46.3% discount to its estimated fair value. By this measure, the stock appears notably undervalued.
Result: UNDERVALUED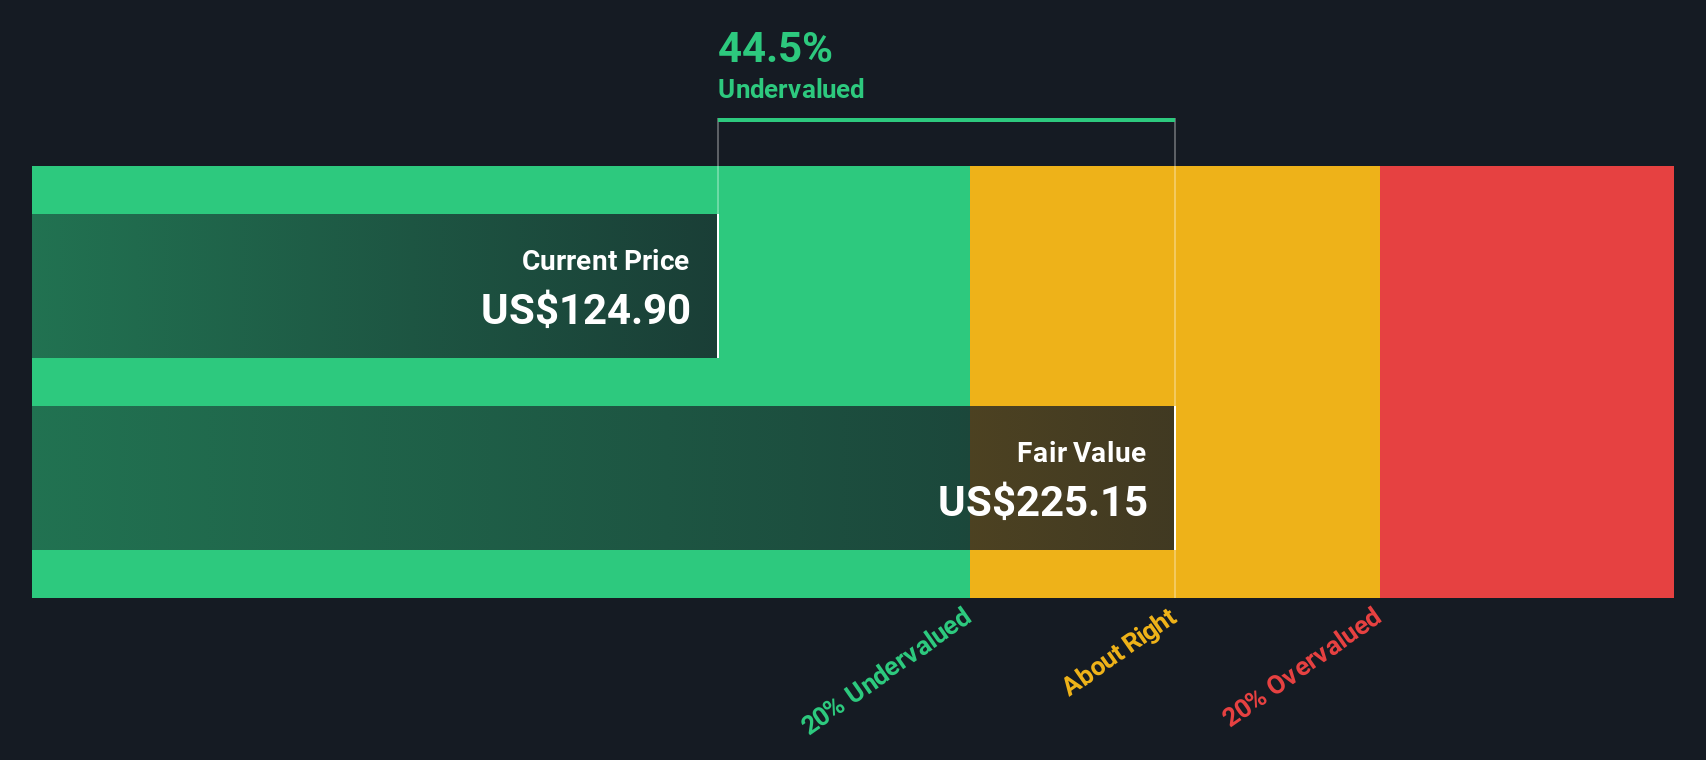
Approach 2: e.l.f. Beauty Price vs Earnings
The Price-to-Earnings (PE) ratio is a widely used method for valuing profitable companies because it measures how much investors are willing to pay today for each dollar of current earnings. For companies generating consistent profits, the PE ratio offers a direct link between price and bottom-line performance, making it especially informative.
It is important to note that higher growth prospects or lower risk typically justify a higher PE ratio. In contrast, slower growth or more uncertainty should lead to a lower ratio. This is why PE ratios can vary sharply across industries and individual companies.
Currently, e.l.f. Beauty trades at a PE ratio of 72.6x. That is significantly higher than the industry average of 22.5x for personal products as well as the average of 26.3x among its peers. Simply Wall St’s Fair Ratio for e.l.f. Beauty, which adjusts for high expected earnings growth, margins, and sector risk, sits at 39.5x. This means the stock is trading quite a bit above what could be considered a fair multiple, even when accounting for premium growth.
Result: OVERVALUED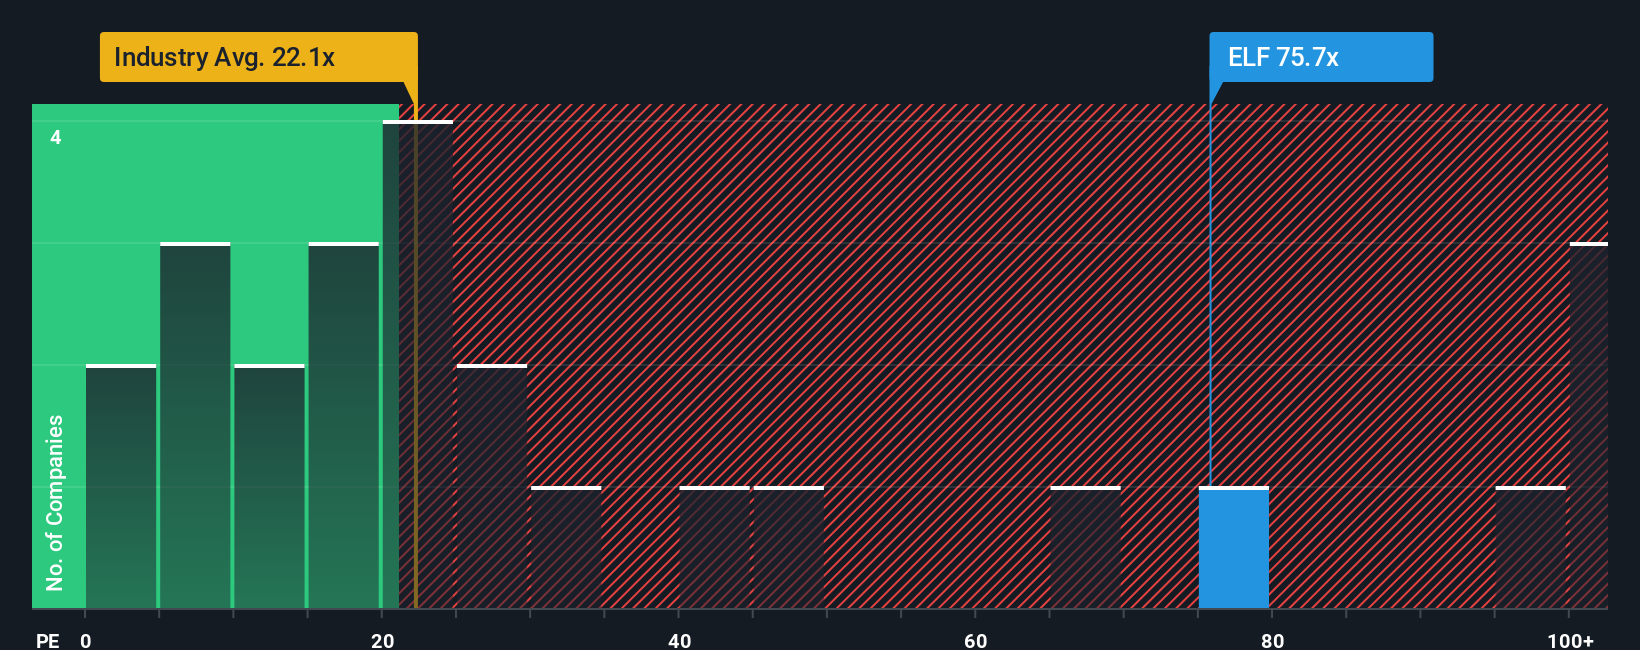
Upgrade Your Decision Making: Choose your e.l.f. Beauty Narrative
Narratives are the story you tell about a company and its future, tying together what you believe about its business, its numbers, and where its share price should be today.
Rather than just crunching numbers, a Narrative connects your perspective on e.l.f. Beauty’s brand, strategy, and risk, then translates that viewpoint into revenue and earnings estimates and, ultimately, your own sense of fair value.
Narratives are easy to create and share on Simply Wall St, where investors can build, update, and compare their outlooks alongside a global community. This makes the whole process both dynamic and accessible.
This approach helps you decide if and when to buy or sell by showing if your Fair Value (the price you believe the stock is worth) is above or below the current market price.
Plus, your Narrative is never static. It automatically refreshes whenever new information like earnings, news, or industry shifts becomes available, so your investment thesis evolves in real time.
For example, the most optimistic e.l.f. Beauty Narrative might predict a $150 fair value based on brand expansion and rapid earnings growth, while the most cautious view sets it closer to $112, highlighting risks from competition and tariffs.
Do you think there's more to the story for e.l.f. Beauty? Create your own Narrative to let the Community know!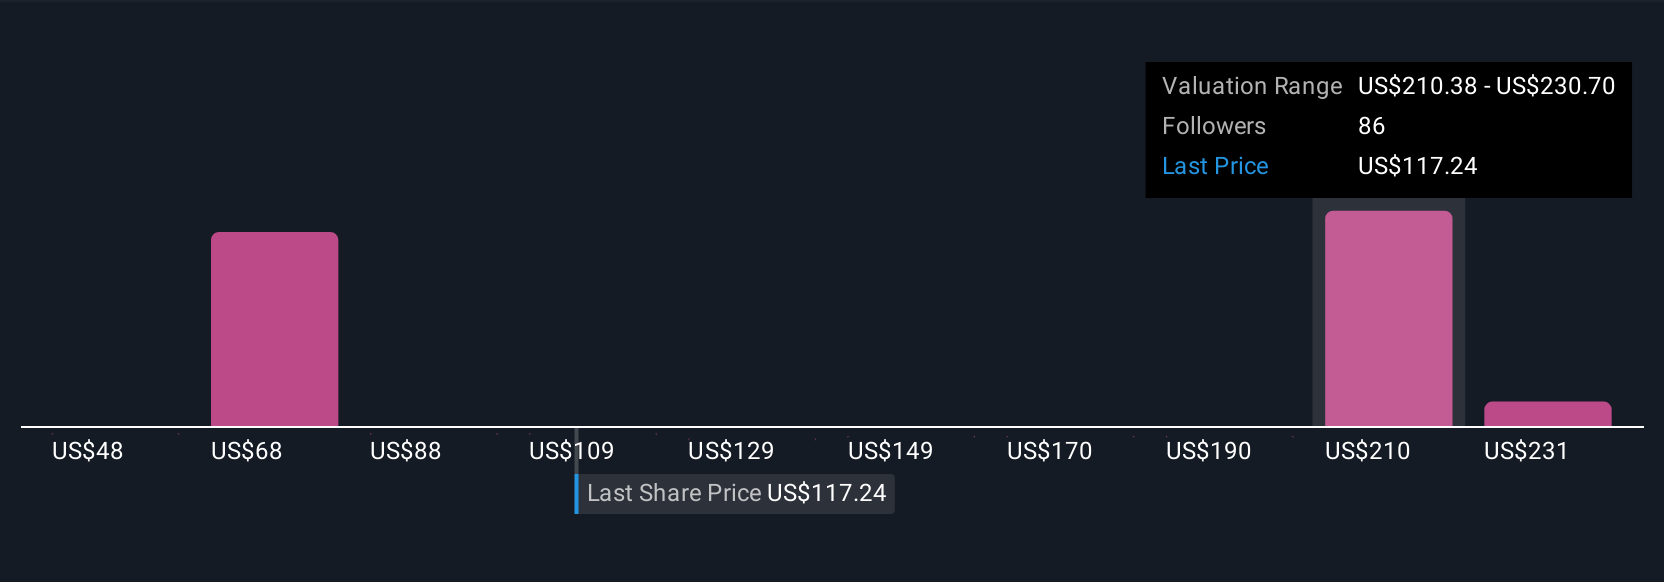
This article by Simply Wall St is general in nature. We provide commentary based on historical data and analyst forecasts only using an unbiased methodology and our articles are not intended to be financial advice. It does not constitute a recommendation to buy or sell any stock, and does not take account of your objectives, or your financial situation. We aim to bring you long-term focused analysis driven by fundamental data. Note that our analysis may not factor in the latest price-sensitive company announcements or qualitative material. Simply Wall St has no position in any stocks mentioned.
Have feedback on this article? Concerned about the content? Get in touch with us directly. Alternatively, email editorial-team@simplywallst.com
Contact Us
Contact Number : +852 3852 8500Service Email : service@webull.hkBusiness Cooperation : marketinghk@webull.hkWebull Securities Limited is licensed with the Securities and Futures Commission of Hong Kong (CE No. BNG700) for carrying out Type 1 License for Dealing in Securities, Type 2 License for Dealing in Futures Contracts and Type 4 License for Advising on Securities.

English