
What Does JD.com’s Final Stage Ceconomy Deal Mean For Its 2025 Valuation?
Trying to figure out whether to buy, hold, or walk away from JD.com’s stock? You’re definitely not alone. JD.com tends to get investors talking, and for good reason. Lately, its price movement has been anything but boring. While the one-day and one-week numbers show slight losses of about 1.7% and 2.7% respectively, a look farther back reveals a different story. Over the past year, JD.com has delivered a 14% total return for investors, even as the stock experienced a bumpy ride down over the last three and five years. That jump in the past 12 months is starting to catch the market’s attention and is prompting a re-evaluation of its growth potential and risk.
Recent news may have played a key role. JD.com is making aggressive moves, with its rumored acquisition talks with Ceconomy reportedly in the final stages and a high-profile battle with Alibaba for dominance in China’s instant delivery market. Additionally, JD has been shortlisted as a potential investor in Starbucks’ China business, which signals that the company’s ambitions are on the rise even as consumer sentiment remains cautious.
All of this brings us to the central question: How much is JD.com really worth right now? By crunching the numbers, the company’s value score comes in at 5 out of 6, suggesting JD.com is seen as undervalued by most measures, though not quite a perfect six. Next, we’ll take a closer look at the different valuation methods to see exactly where JD stacks up, before discussing a more effective way to interpret these findings at the end.
JD.com delivered 14.0% returns over the last year. See how this stacks up to the rest of the Multiline Retail industry.Approach 1: JD.com Cash Flows
The Discounted Cash Flow (DCF) model provides a way to estimate what JD.com is worth by projecting its future cash flows and discounting them back to today's value. In other words, it tries to determine what a company is really worth based on how much cash it is expected to generate in the coming years.
According to the latest numbers, JD.com's current Free Cash Flow stands at approximately $912 million. Analysts expect this figure to rise sharply over time. By 2028, projected Free Cash Flow could reach an impressive $66.6 billion. Looking ahead to 2035, forecasts suggest even higher annual free cash flow, with substantial compounding growth anticipated over the next decade.
Using these projections in the DCF model, JD.com's intrinsic value is estimated at $120.62 per share. When compared with the current market price, this valuation indicates the stock is about 74.1% undervalued. The numbers suggest a sizeable disconnect between JD.com's underlying fundamentals and its share price.
Result: UNDERVALUED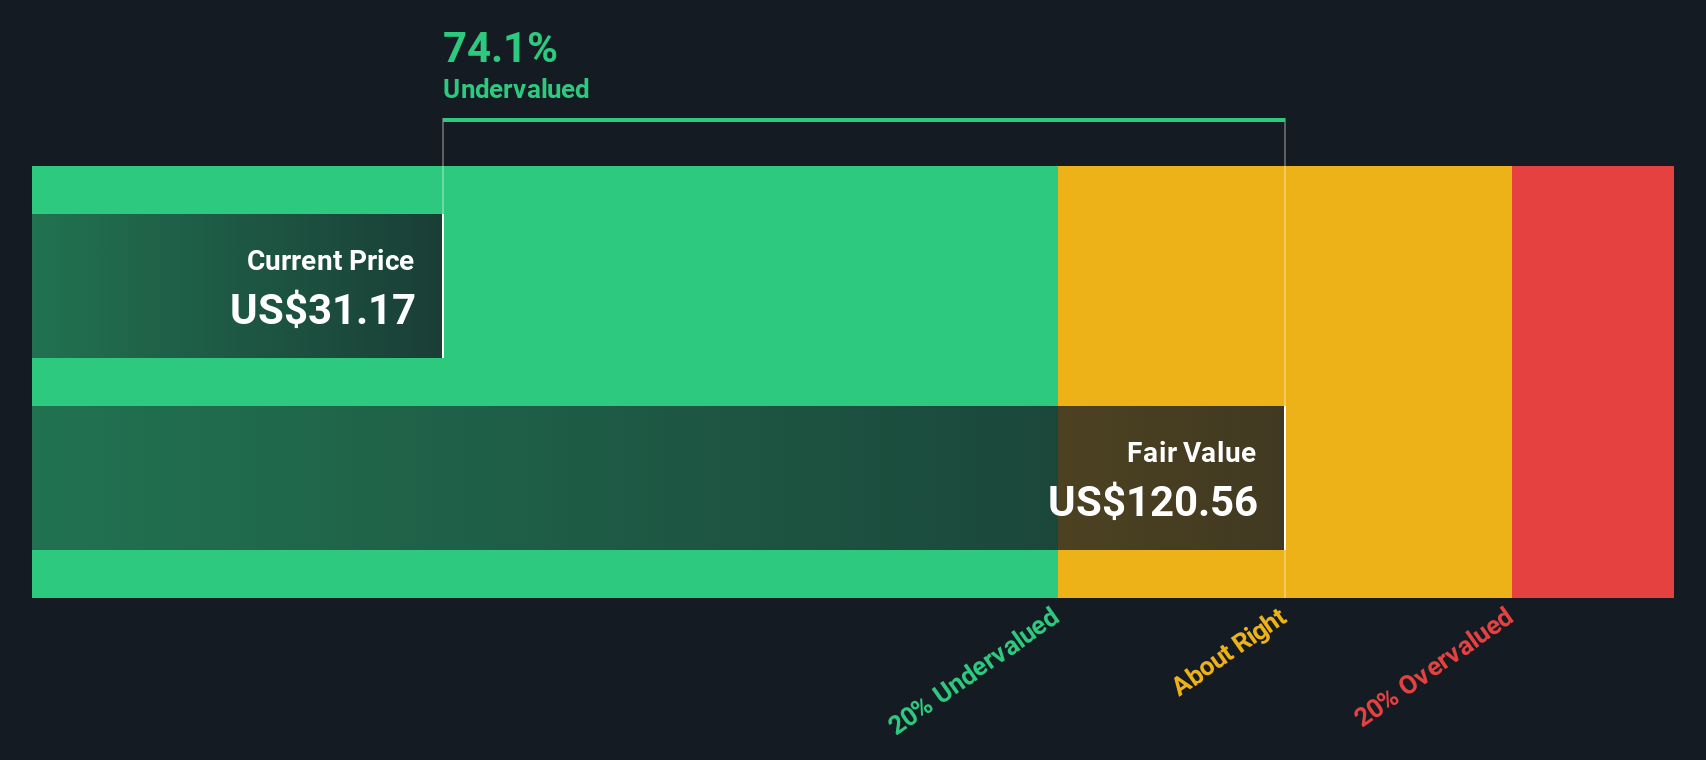
Approach 2: JD.com Price vs Earnings
The Price-to-Earnings (PE) ratio is a widely used valuation metric, especially when analyzing profitable companies like JD.com. It offers a clear and familiar way to gauge how much investors are willing to pay for each dollar of the company’s earnings. This metric is particularly helpful because it factors in both the business’s current profitability and the market’s future growth expectations.
When setting a “normal” or “fair” PE ratio, analysts consider factors such as a company’s projected earnings growth, its overall risk profile, and how it compares to industry competitors. Fast-growing and less risky companies generally justify higher PE ratios, while those that are underperforming or facing higher uncertainty tend to have lower ratios.
JD.com currently trades at a PE ratio of 8.2x. This is notably lower than the Multiline Retail industry average of 22.5x and the average of its peers, which is an even higher 59.4x. Simply Wall St’s Fair Ratio for JD.com is 22.4x, a figure calibrated to reflect the company’s earnings growth, profit margins, market size, and risks. With JD.com’s actual PE significantly below this fair value benchmark, the shares appear undervalued compared to both industry norms and the company’s own underlying fundamentals.
Result: UNDERVALUED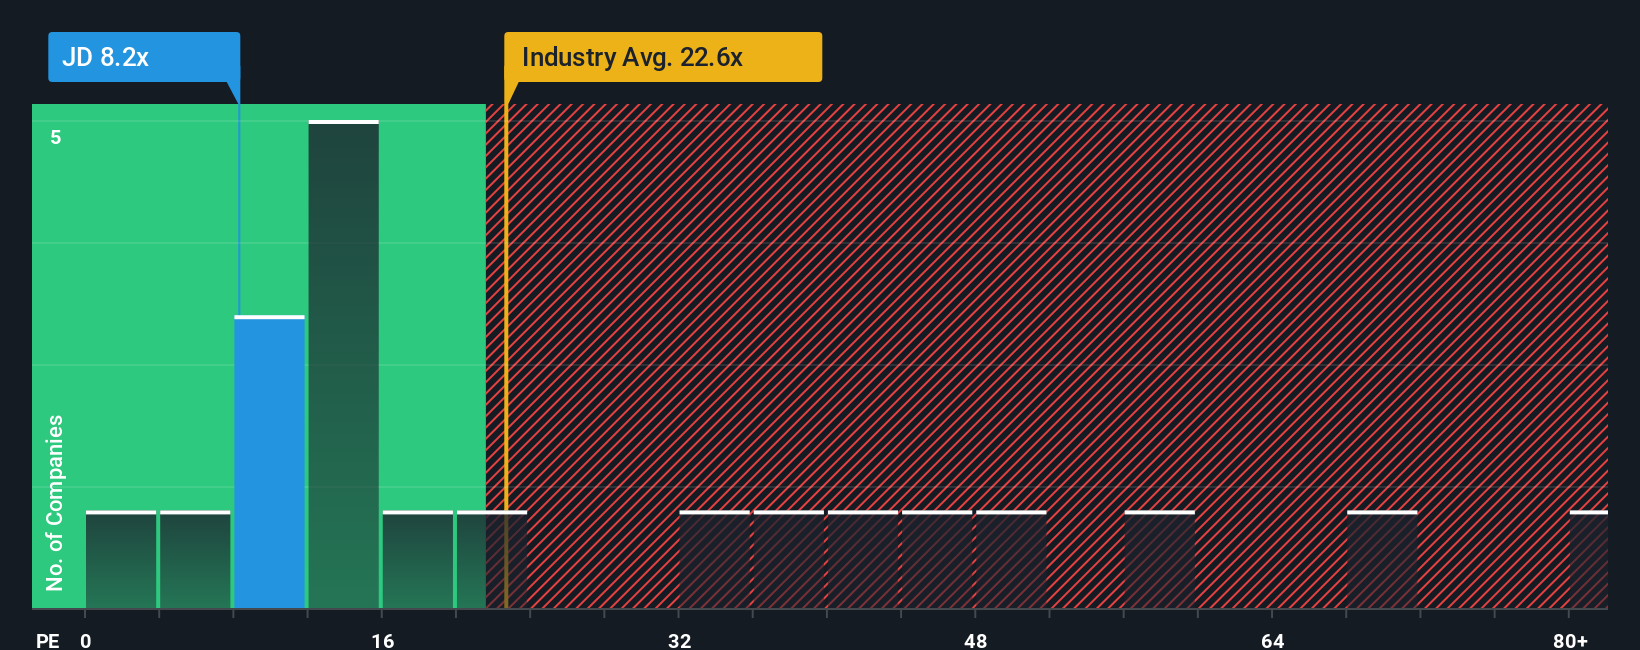
Upgrade Your Decision Making: Choose your JD.com Narrative
Rather than relying solely on traditional valuation metrics, investors can use a Narrative to frame investment decisions. This approach involves telling the story behind JD.com’s numbers, outlining key assumptions about future revenue, earnings, and margins, and then observing how those forecasts translate into a fair value estimate.
A Narrative links your beliefs about JD.com’s prospects to a transparent financial forecast and ultimately an actionable fair value. This makes it straightforward to determine whether the current price offers a bargain or appears overvalued. On the Simply Wall St platform, Narratives are available to everyone, drawing on insights from millions of investors to help you share, compare, and refine your viewpoint in real time.
By setting your assumptions and monitoring as the Narrative is automatically updated in response to new earnings reports or market-moving news, you can quickly assess if your view still holds or needs to be adjusted. For example, some investors see JD.com’s supply chain efficiency and technology investments supporting a fair value near $70, while others, who are more concerned about margin pressures and strong competition, estimate a figure as low as $28. Narratives allow you to compare your perspective with the broader community, helping you make smarter, more confident decisions on when to buy, hold, or sell.
Do you think there's more to the story for JD.com? Create your own Narrative to let the Community know!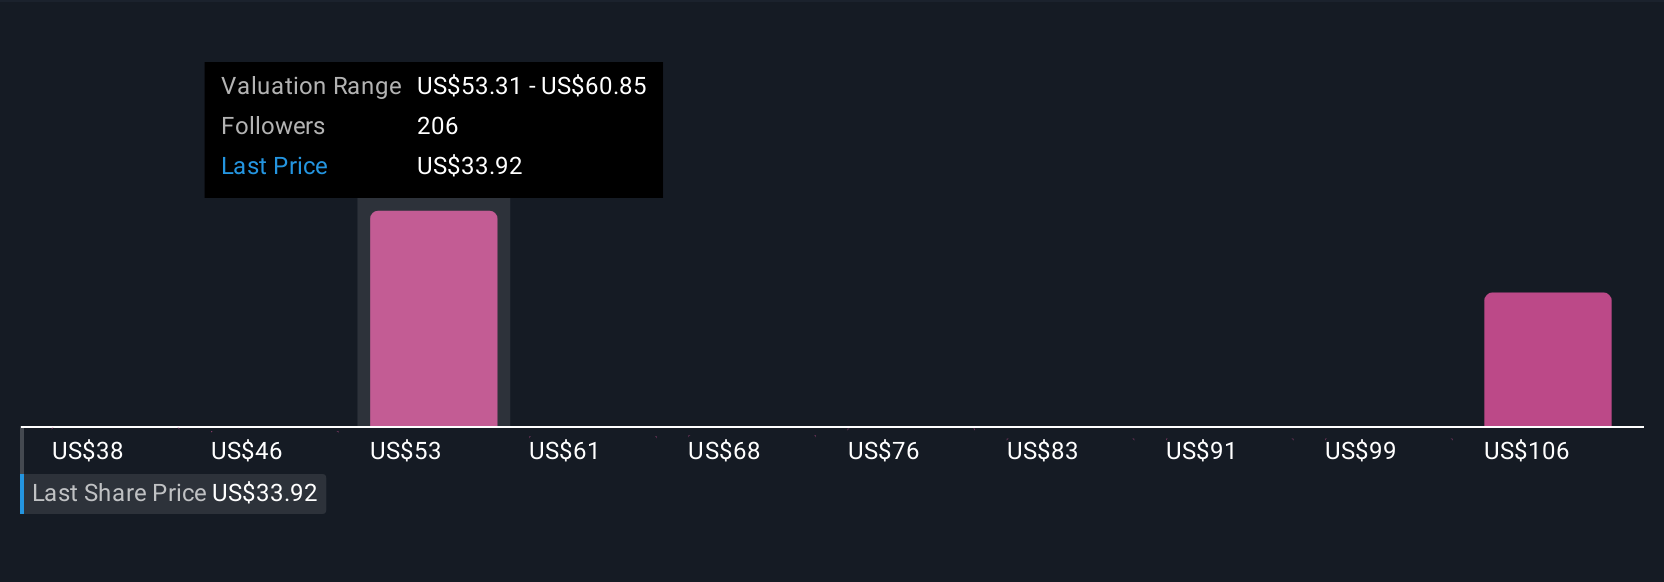
This article by Simply Wall St is general in nature. We provide commentary based on historical data and analyst forecasts only using an unbiased methodology and our articles are not intended to be financial advice. It does not constitute a recommendation to buy or sell any stock, and does not take account of your objectives, or your financial situation. We aim to bring you long-term focused analysis driven by fundamental data. Note that our analysis may not factor in the latest price-sensitive company announcements or qualitative material. Simply Wall St has no position in any stocks mentioned.
Have feedback on this article? Concerned about the content? Get in touch with us directly. Alternatively, email editorial-team@simplywallst.com
Contact Us
Contact Number : +852 3852 8500Service Email : service@webull.hkBusiness Cooperation : marketinghk@webull.hkWebull Securities Limited is licensed with the Securities and Futures Commission of Hong Kong (CE No. BNG700) for carrying out Type 1 License for Dealing in Securities, Type 2 License for Dealing in Futures Contracts and Type 4 License for Advising on Securities.

English