
Does Amphenol’s Recent Surge Signal Further Opportunity After April’s Strong Earnings Report?
If you have been watching Amphenol stock lately, you are not alone, and you are probably asking yourself whether now is the right time to add APH to your portfolio or wait for a better entry point. The last five years have been a wild ride, with the stock more than tripling over that period. In just the past year, Amphenol’s total return hit an impressive 63.9%, outpacing even bullish expectations. Momentum has carried through 2024 as well, with the price up 58.5% year to date and now trading at $109.36 per share. This is just a touch under analyst price targets.
Behind the strong price action, Amphenol has recorded double-digit annual growth in both revenues and earnings, which helps explain some of the enthusiasm. But the big question is whether the current valuation still leaves room for upside or if most of the good news is already reflected in the price. According to a recent analysis across six key valuation checks, the company scores a 1 out of 6, meaning it appears undervalued by only one metric. In other words, it is not a clear deep value play, but there may still be opportunities here depending on where you look.
To help make sense of where Amphenol stands now, we will explore the different valuation approaches analysts use to assess the stock’s prospects. Before deciding how compelling APH might be on valuation alone, stay tuned for an additional angle at the end that could provide a more nuanced perspective on its true worth.
Amphenol delivered 63.9% returns over the last year. See how this stacks up to the rest of the Electronic industry.Approach 1: Amphenol Cash Flows
The Discounted Cash Flow (DCF) model estimates a company’s value by taking its projected future cash flows and calculating what they are worth in today’s dollars. This approach helps investors assess whether a stock price reflects its true long-term potential.
For Amphenol, the most recent twelve months of Free Cash Flow totaled $3.0 billion, with analysts forecasting steady annual growth in the coming years. By 2028, projections place Amphenol’s Free Cash Flow at $5.6 billion and as high as $8.5 billion by 2035. These estimates are central to the DCF calculation.
Based on this model, Amphenol’s estimated intrinsic value is $97.67 per share. Compared to the current share price of $109.36, this suggests the stock is approximately 12.0% overvalued according to the DCF method. In other words, recent price momentum appears to have pushed the stock above what conservative long-term cash flow analysis would suggest.
Result: OVERVALUED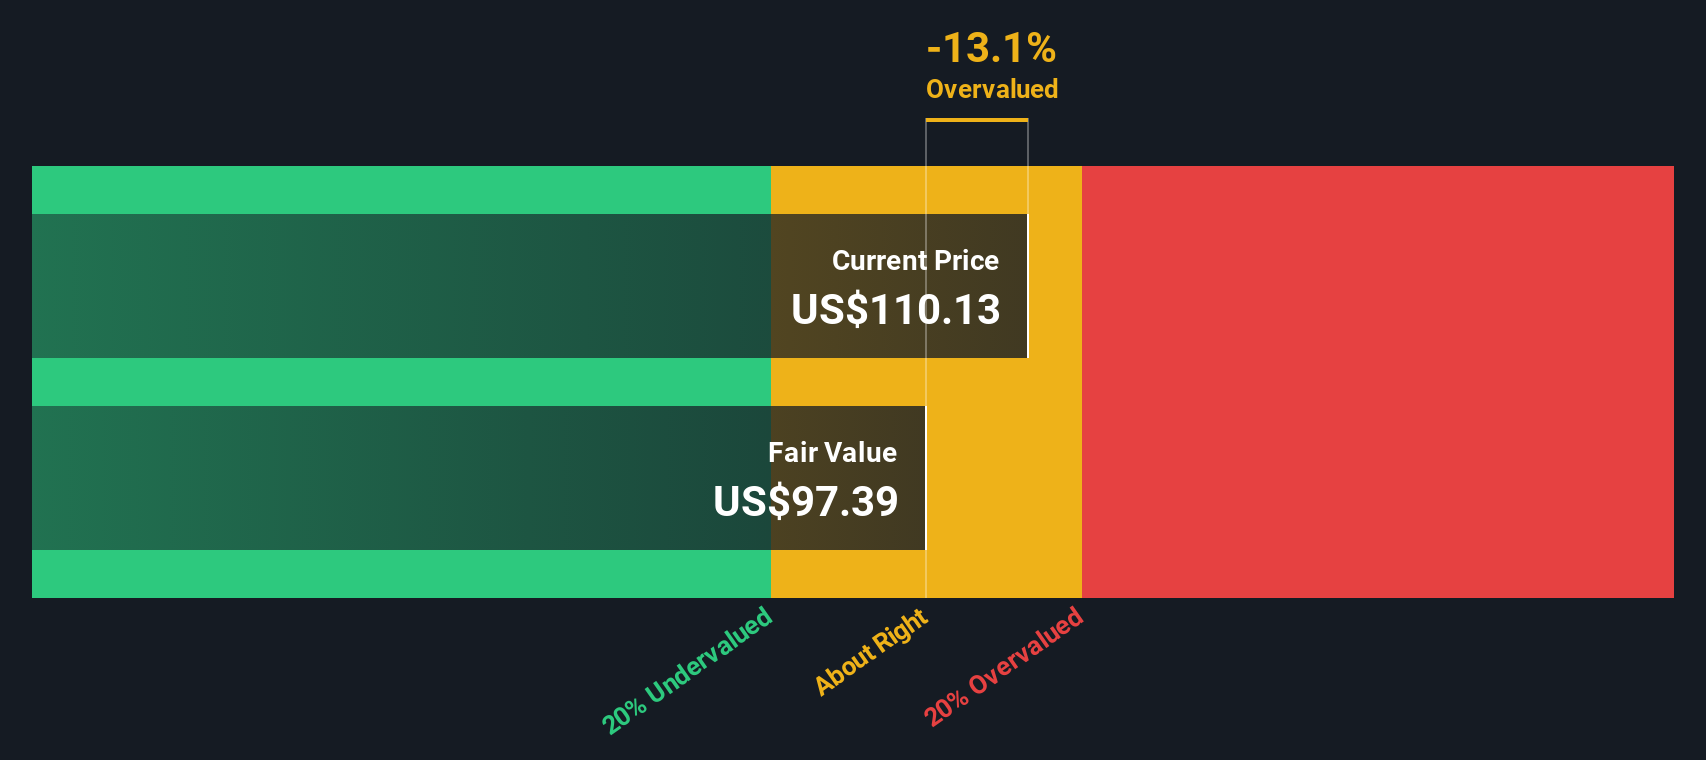
Approach 2: Amphenol Price vs Earnings (PE)
When evaluating consistently profitable companies like Amphenol, the Price-to-Earnings (PE) ratio is often the preferred metric. This is because the PE ratio gives a direct measure of how much investors are willing to pay for each dollar of the company’s current earnings. This approach is especially useful for businesses with stable and growing profits.
Growth prospects and perceived risk both play a major role in determining what qualifies as a “normal” or “fair” PE ratio. Companies expected to deliver strong, reliable earnings growth can command higher multiples. In contrast, riskier or slower-growing firms tend to trade with a lower PE ratio in the market.
Amphenol is currently trading at a PE of 42x, which is higher than the Electronic industry average of 23.9x and also above its peer group average of 48.6x. However, Simply Wall St’s proprietary Fair Ratio, which considers factors like Amphenol’s growth outlook, profit margins, and market risks, indicates a fair value PE of 29.7x. Since the actual PE ratio is materially higher than the fair ratio, this suggests the stock is somewhat overvalued using this approach.
Result: OVERVALUED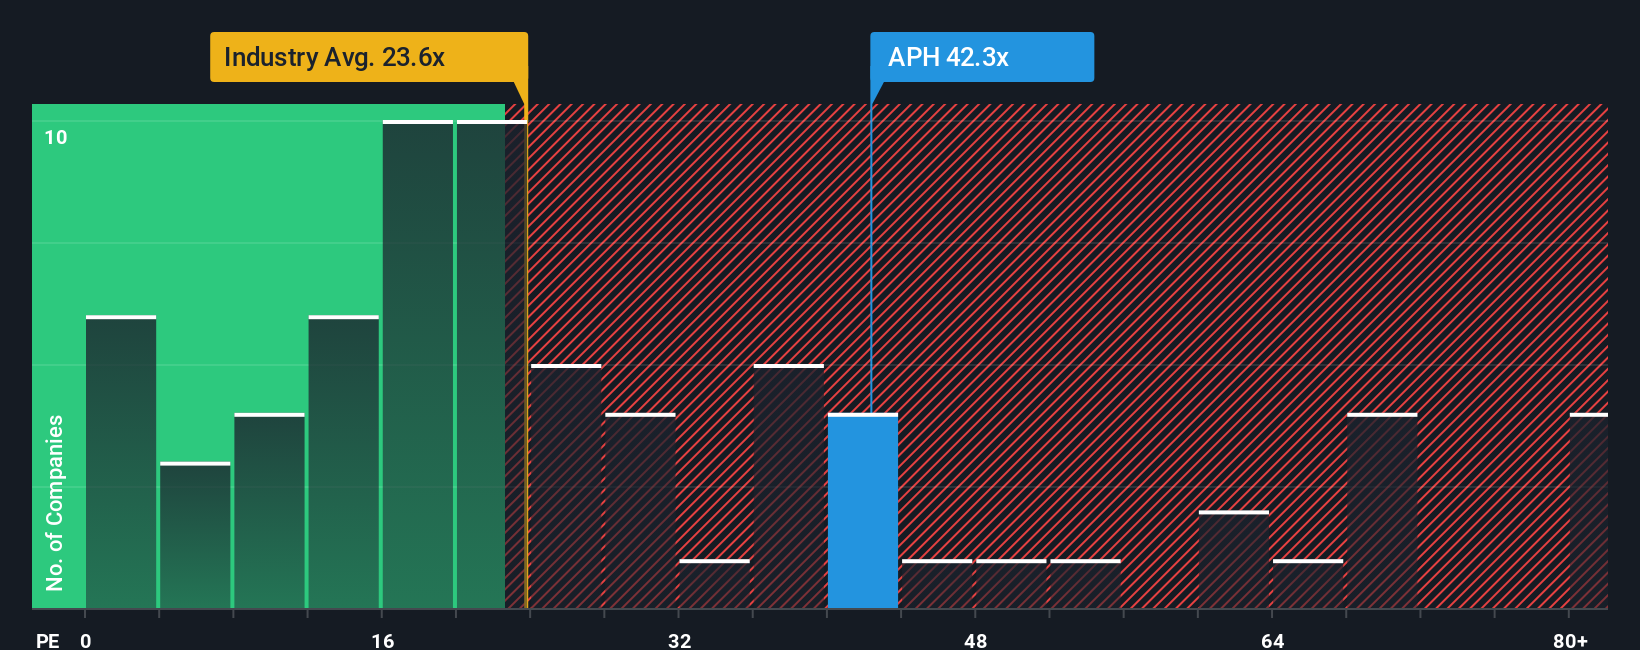
Upgrade Your Decision Making: Choose your Amphenol Narrative
While valuation ratios like PE provide a snapshot of a stock’s relative price, Narratives take investing to a new level by letting you tie your own story and expectations about a company directly to the numbers. Your view on future revenue, profit margins, and fair value become part of a living forecast you can easily track.
A Narrative is a simple and accessible way for any investor to connect the company’s business story with a custom set of financial projections. It instantly calculates a fair value based on those assumptions, and then compares that with the market price to see whether your thesis signals a buy or sell.
With tools like Simply Wall St, Narratives are updated live as new information comes in, whether it is breaking news or fresh earnings. This helps millions of investors adjust their decision making quickly and with confidence.
For example, one Amphenol Narrative might expect strong AI-driven datacenter demand and assign a bullish fair value of $127 per share. Another, more cautious investor concerned about tech cyclicality and acquisition risks might set their estimate as low as $85 per share. This reveals how different perspectives can guide buying or selling decisions in real time.
Do you think there's more to the story for Amphenol? Create your own Narrative to let the Community know!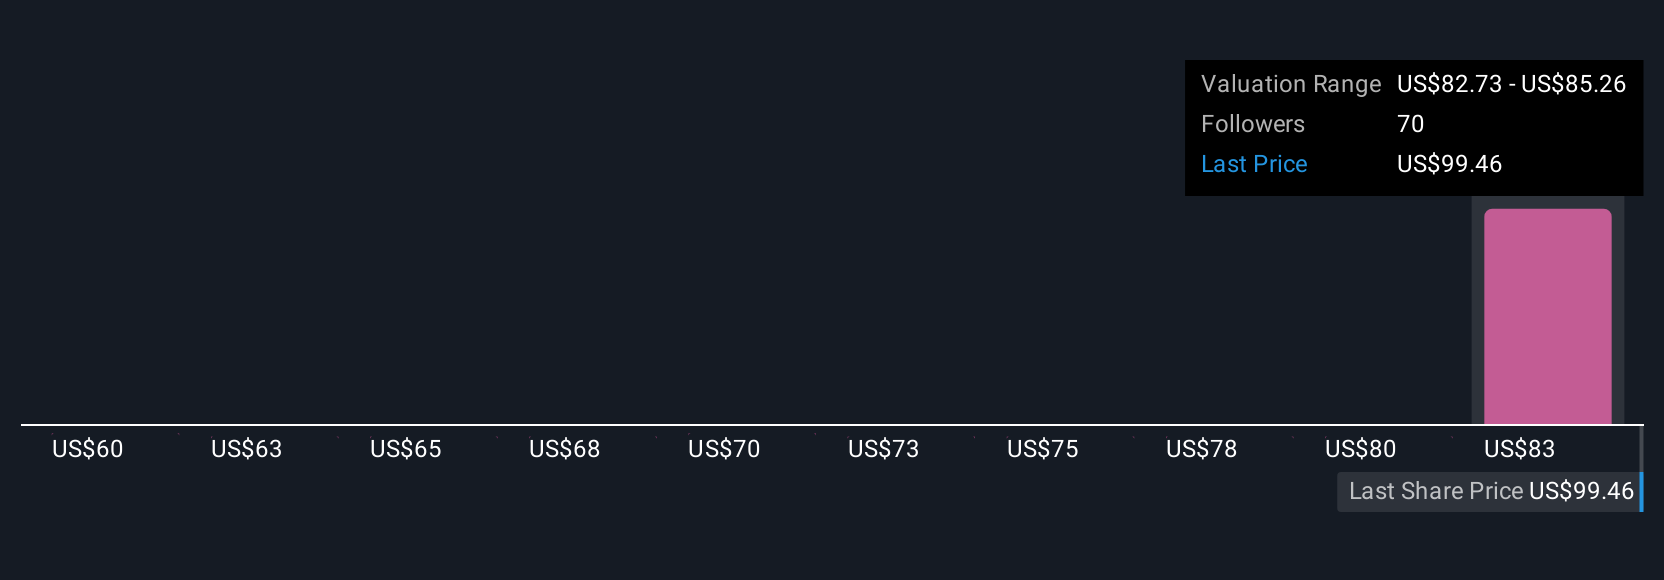
This article by Simply Wall St is general in nature. We provide commentary based on historical data and analyst forecasts only using an unbiased methodology and our articles are not intended to be financial advice. It does not constitute a recommendation to buy or sell any stock, and does not take account of your objectives, or your financial situation. We aim to bring you long-term focused analysis driven by fundamental data. Note that our analysis may not factor in the latest price-sensitive company announcements or qualitative material. Simply Wall St has no position in any stocks mentioned.
Have feedback on this article? Concerned about the content? Get in touch with us directly. Alternatively, email editorial-team@simplywallst.com
Contact Us
Contact Number : +852 3852 8500Service Email : service@webull.hkBusiness Cooperation : marketinghk@webull.hkWebull Securities Limited is licensed with the Securities and Futures Commission of Hong Kong (CE No. BNG700) for carrying out Type 1 License for Dealing in Securities, Type 2 License for Dealing in Futures Contracts and Type 4 License for Advising on Securities.

English