
Jefferies Financial Group (JEF): Assessing Valuation After Major Debt Issuances and Shifting Capital Strategy
Price-to-Earnings of 22.3x: Is it justified?
Jefferies Financial Group is trading at a Price-to-Earnings (P/E) ratio of 22.3x, which is below the Capital Markets industry average of 27.1x. This suggests the stock may be valued more conservatively than its peers, but it is still priced above its estimated fair value.
The P/E ratio is a common valuation measure that reflects how much investors are willing to pay for each dollar of the company’s earnings. For firms in the capital markets sector, this metric highlights expectations for profit growth, perceived risk, and overall market sentiment about future business prospects.
Although Jefferies’ P/E is lower than the industry average, it is considered expensive compared to the company’s fair P/E ratio of 19.3x. This brings up questions about whether the market is anticipating stronger-than-expected future earnings or if current optimism is resulting in a premium that may not be justified by fundamentals.
Result: Fair Value of $56.00 (OVERVALUED)
See our latest analysis for Jefferies Financial Group.However, a rapid shift in interest rates or weaker-than-expected earnings growth could challenge the momentum that Jefferies has recently enjoyed.
Find out about the key risks to this Jefferies Financial Group narrative.Another View: Discounted Cash Flow Model
While the earnings multiple suggests Jefferies is priced above its fair value, our DCF model presents an even more cautious perspective. According to this model, the shares appear to trade at a substantial premium. Which method should investors trust?
Look into how the SWS DCF model arrives at its fair value.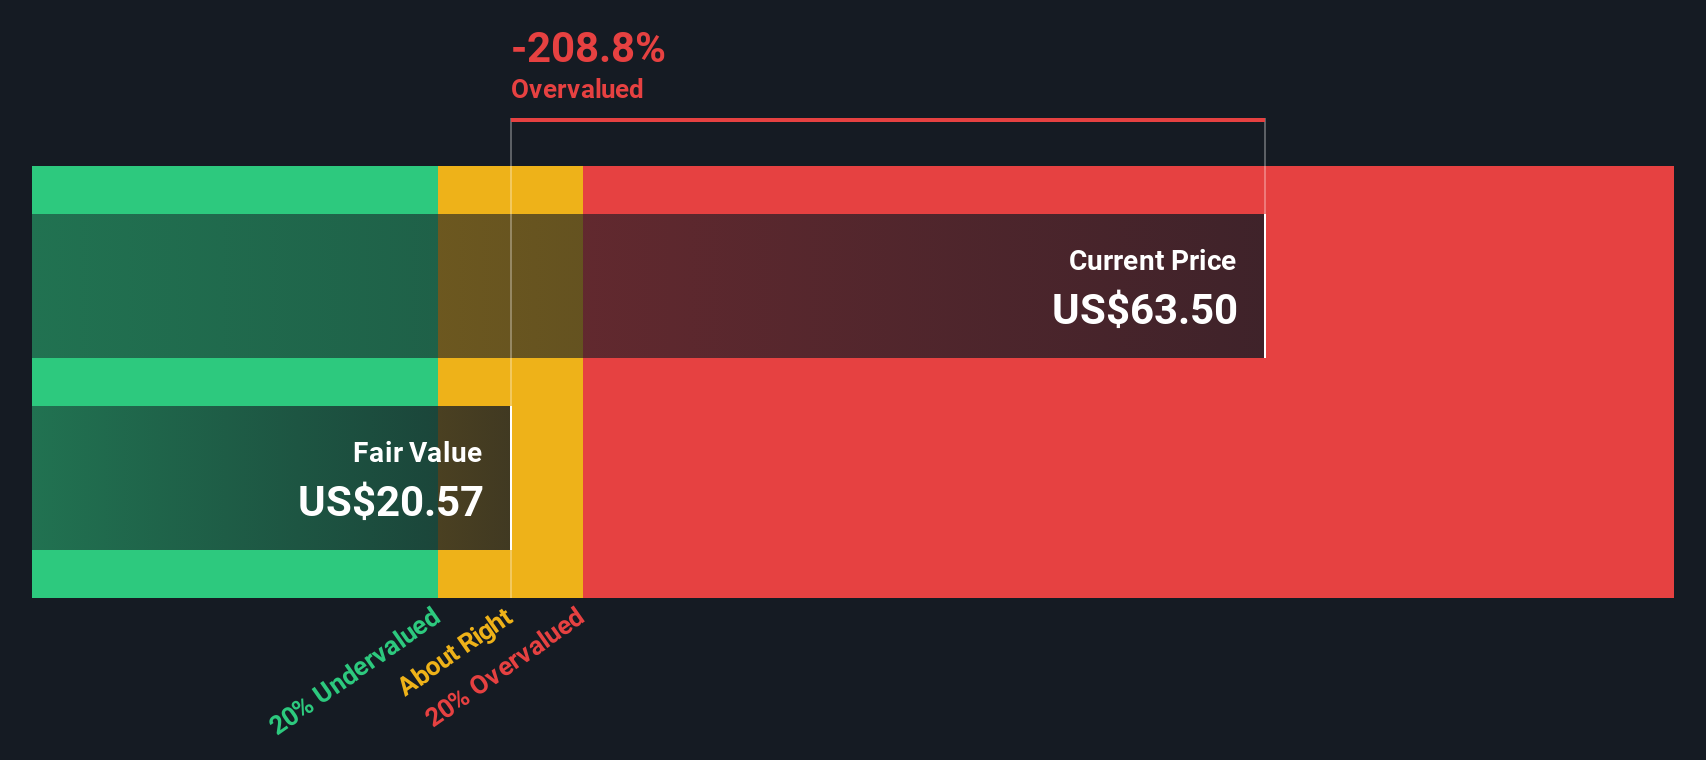
Build Your Own Jefferies Financial Group Narrative
If you have a different perspective or want to analyze the figures first-hand, you can easily craft your own story in just a few minutes. Go ahead and do it your way.
A great starting point for your Jefferies Financial Group research is our analysis highlighting 3 key rewards and 1 important warning sign that could impact your investment decision.
Looking for more investment ideas?
Don’t settle for just one great stock when countless opportunities could be within reach. Use Simply Wall Street’s screeners to find companies primed to outperform, future-focused sectors, or strong dividend plays. Start making smarter, more confident investment choices today. These tailored screens help ensure you never miss what’s coming next.
- Supercharge your portfolio with stable income by checking out dividend stocks with yields > 3%, featuring companies offering robust yields above 3% and a track record of rewarding shareholders.
- Tap into the artificial intelligence revolution. Uncover market movers with real AI momentum through AI penny stocks, spotlighting cutting-edge companies riding the next wave of tech disruption.
- Stay ahead of market overvaluation by evaluating undervalued stocks based on cash flows. Here you’ll find stocks trading below their intrinsic value based on solid cash flows and compelling fundamentals.
This article by Simply Wall St is general in nature. We provide commentary based on historical data and analyst forecasts only using an unbiased methodology and our articles are not intended to be financial advice. It does not constitute a recommendation to buy or sell any stock, and does not take account of your objectives, or your financial situation. We aim to bring you long-term focused analysis driven by fundamental data. Note that our analysis may not factor in the latest price-sensitive company announcements or qualitative material. Simply Wall St has no position in any stocks mentioned.
Have feedback on this article? Concerned about the content? Get in touch with us directly. Alternatively, email editorial-team@simplywallst.com
Contact Us
Contact Number : +852 3852 8500Service Email : service@webull.hkBusiness Cooperation : marketinghk@webull.hkWebull Securities Limited is licensed with the Securities and Futures Commission of Hong Kong (CE No. BNG700) for carrying out Type 1 License for Dealing in Securities, Type 2 License for Dealing in Futures Contracts and Type 4 License for Advising on Securities.

English