
Morningstar (MORN): Assessing Valuation After Wealth Firms Transition to SS&C Black Diamond
If you are holding or eyeing Morningstar (MORN), you have probably noticed some buzz following news that over 400 wealth management firms will transition from the Morningstar Office platform to SS&C’s Black Diamond Wealth Solutions. With many firms already migrated and early adopters reporting smoother workflows, this surge of transitions feels like more than a simple technology shuffle. It is a clear signal that Morningstar’s competitive positioning and its strategic partnerships are facing real market tests. For investors, this raises big questions about how deeply these client movements may impact future revenue streams and the company’s broader value proposition.
Morningstar’s stock has trended downward this year, with losses mounting to 15% over the past year and a year-to-date dip of 20%. Despite strong three- and five-year returns, recent momentum is clearly negative. The recent client departures are one factor in a wider story for the company, which still saw its annual revenue and net income grow by 7% and 9% respectively. While the transition deal offers perks like preferred pricing and integrated suite access for clients, the real message may be about shifting industry preferences rather than a reflection on Morningstar’s product quality or long-term prospects.
So here is the question: after this year’s decline, is Morningstar a bargain that is being overlooked, or is the market correctly accounting for future challenges in its current price?
Price-to-Earnings of 27.5x: Is it justified?
Morningstar trades at a price-to-earnings (P/E) ratio of 27.5x, which is slightly higher than the US Capital Markets industry average of 27.1x. This suggests the stock may be somewhat overvalued compared to its industry peers when using this traditional earnings-based metric.
The price-to-earnings ratio measures how much investors are willing to pay for each dollar of earnings. In a sector built on recurring fee revenues and intellectual property, the P/E multiple can reflect both current profitability and the market’s expectations for future growth. A premium P/E indicates that the market anticipates strong performance or unique competitive advantages versus peers.
Although Morningstar is priced above the industry average, its recent double-digit earnings growth and high return on equity point to robust underlying business trends. However, its valuation could be factoring in expectations for these trends to continue or even accelerate.
Result: Fair Value of $263.82 (ABOUT RIGHT)
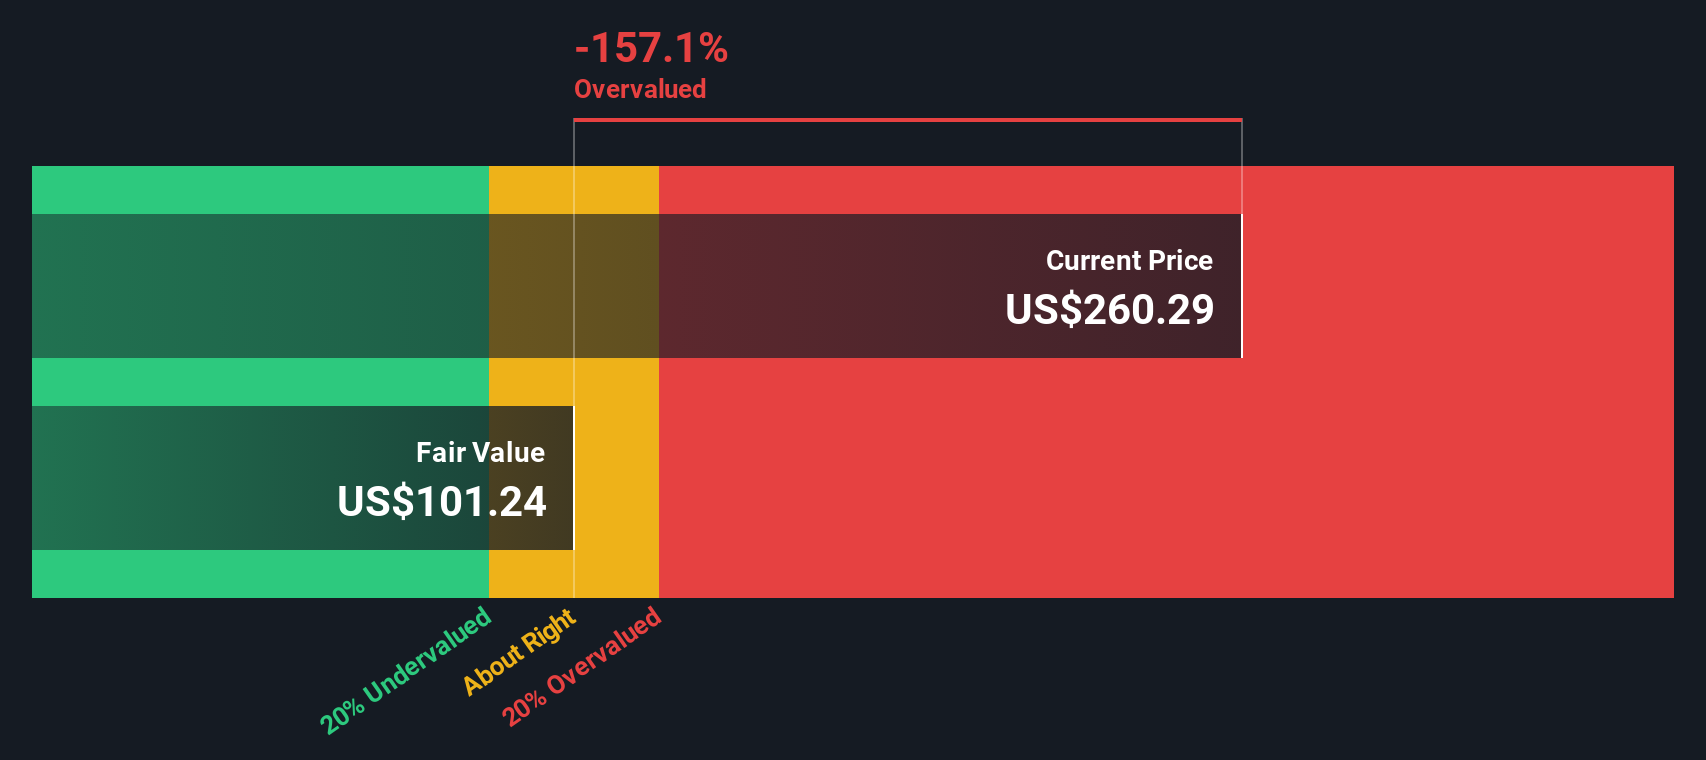
See our latest analysis for Morningstar. However, sustained client departures and continued underperformance compared to analyst price targets could spark further bearish sentiment in the months ahead. Find out about the key risks to this Morningstar narrative.Another View: Discounted Cash Flow
Looking through the lens of our DCF model gives a very different picture. This approach suggests Morningstar is actually trading well above its calculated fair value, which challenges the optimism implied by earnings multiples. Could DCF be signaling caution where the market sees promise?
Look into how the SWS DCF model arrives at its fair value.For a breakdown of the model and its assumptions, take a closer look below.
Build Your Own Morningstar Narrative
If you have a different perspective on Morningstar’s outlook or want to examine the numbers in your own way, you can put together your own view in just a few minutes and do it your way.
A great starting point for your Morningstar research is our analysis highlighting 3 key rewards and 1 important warning sign that could impact your investment decision.
Looking for more investment ideas?
Why limit your search to one stock when there is a world of opportunity waiting? Use the Simply Wall Street Screener to pinpoint investment themes that match your strategy and spot high-potential prospects before others do. Here are a few compelling places to get started:
- Target steady income by researching companies offering dividend stocks with yields > 3% to add reliable yield to your portfolio.
- Capture growth in healthcare technology by following the latest healthcare AI stocks leading innovation in medicine and patient care.
- Take advantage of the shift toward undervalued opportunities and pursue undervalued stocks based on cash flows to find stocks priced below their cash flow potential.
This article by Simply Wall St is general in nature. We provide commentary based on historical data and analyst forecasts only using an unbiased methodology and our articles are not intended to be financial advice. It does not constitute a recommendation to buy or sell any stock, and does not take account of your objectives, or your financial situation. We aim to bring you long-term focused analysis driven by fundamental data. Note that our analysis may not factor in the latest price-sensitive company announcements or qualitative material. Simply Wall St has no position in any stocks mentioned.
Have feedback on this article? Concerned about the content? Get in touch with us directly. Alternatively, email editorial-team@simplywallst.com
Contact Us
Contact Number : +852 3852 8500Service Email : service@webull.hkBusiness Cooperation : marketinghk@webull.hkWebull Securities Limited is licensed with the Securities and Futures Commission of Hong Kong (CE No. BNG700) for carrying out Type 1 License for Dealing in Securities, Type 2 License for Dealing in Futures Contracts and Type 4 License for Advising on Securities.

English