
Oxford Lane Capital (OXLC): Evaluating Valuation After Reverse Stock Split and Higher Per-Share Distributions
Oxford Lane Capital (OXLC) recently put itself in the spotlight with a 1-for-5 reverse stock split. For current and prospective investors, this move is especially interesting because it not only consolidated shares, but was paired with an increase in monthly per-share distributions for the remainder of 2025. The reverse split adjusted each holder’s account so every five shares became one, streamlining the share structure while also triggering changes to dividend payments going forward. On the surface, it might seem like a routine bit of corporate housekeeping; however, when a company reworks its capital structure and adjusts distributions, it is a signal that may warrant a closer look.
This reverse split arrives against a backdrop of mixed results and price movement for Oxford Lane Capital over the last year. After a challenging period, the stock is down 18% for the past year, with short-term returns still struggling to find momentum. Despite missing earnings expectations in the latest quarter, revenue actually came in stronger than forecast, suggesting the company is still finding ways to generate cash even as market sentiment remains cautious. Combining that with an eightfold total return over the last five years, there is a long-term narrative here that is not captured just by recent volatility.
With the share change complete and new distributions in place, the question for investors is whether Oxford Lane Capital is currently an under-the-radar value, or if the market has already factored in its growth prospects and associated risks for the next phase.
Price-to-Earnings of 33.8x: Is it justified?
Based on valuation multiples, Oxford Lane Capital is currently trading at a Price-to-Earnings (P/E) ratio of 33.8x. This makes it appear expensive compared to the US Capital Markets industry average of 26.7x and an estimated fair P/E ratio of 29.8x.
The P/E ratio helps investors compare a company’s share price to its per-share earnings. It shows how much investors are willing to pay for future profits. In diversified financials such as Oxford Lane Capital, it is a key gauge because earnings can sometimes be volatile or impacted by non-cash factors.
This P/E suggests that the market is putting a premium on Oxford Lane Capital’s earnings relative to its peers. This could reflect investor optimism about future growth or, perhaps, overexuberance. The higher-than-average ratio means the market could be factoring in aggressive recovery or future profitability that may not yet be reflected in recent profit margins.
Result: Fair Value of $17.52 (OVERVALUED)
See our latest analysis for Oxford Lane Capital.However, sustained negative returns this year and elevated valuation could put pressure on Oxford Lane Capital if earnings growth does not keep pace with expectations.
Find out about the key risks to this Oxford Lane Capital narrative.Another View: SWS DCF Model Offers a Different Take
Taking a different approach, the SWS DCF model suggests Oxford Lane Capital may actually be undervalued, even though the high earnings ratio indicates otherwise. Could this deeper look at cash flows tell a more optimistic story?
Look into how the SWS DCF model arrives at its fair value.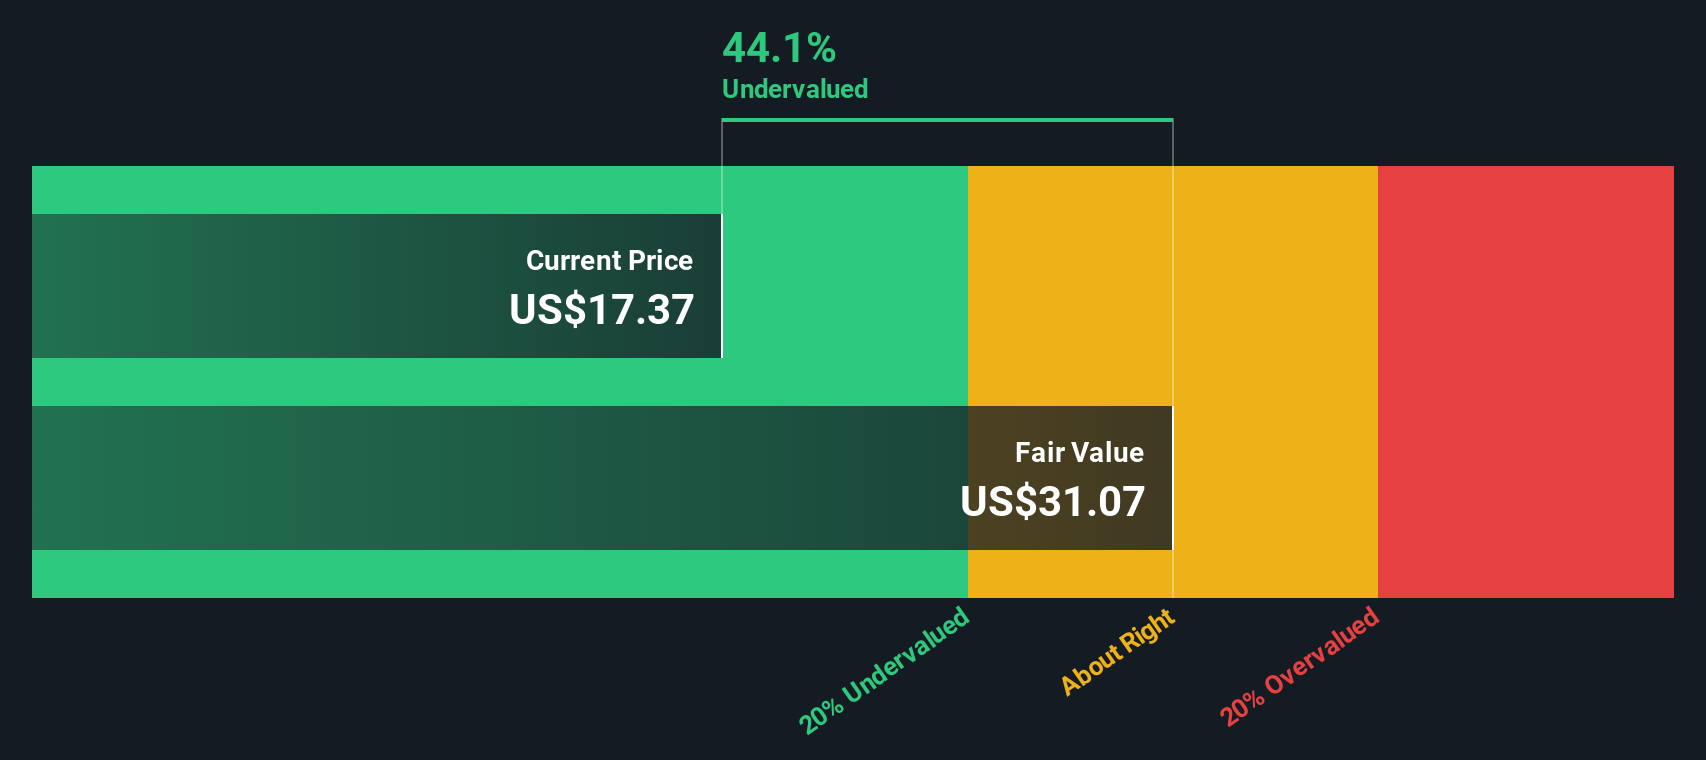
Build Your Own Oxford Lane Capital Narrative
If you see the situation differently or want to draw your own conclusions, consider digging into the numbers to assemble your own perspective in just a few minutes. Do it your way
A great starting point for your Oxford Lane Capital research is our analysis highlighting 2 key rewards and 3 important warning signs that could impact your investment decision.
Looking for more investment ideas?
If you do not look beyond your current holdings, you could miss smart moves. The Simply Wall Street Screener makes it easy to find stocks aligned with your goals.
- Spot opportunities in emerging tech by unpacking the growth potential of quantum computing stocks, which is leading the charge in quantum innovation and advanced computing.
- Capture income potential with dividend stocks with yields > 3%, offering consistent yields above 3% for investors seeking stability and strong cash returns.
- Get ahead of the crowd by evaluating AI penny stocks, which are shaping artificial intelligence advancements and driving transformative change in multiple sectors.
This article by Simply Wall St is general in nature. We provide commentary based on historical data and analyst forecasts only using an unbiased methodology and our articles are not intended to be financial advice. It does not constitute a recommendation to buy or sell any stock, and does not take account of your objectives, or your financial situation. We aim to bring you long-term focused analysis driven by fundamental data. Note that our analysis may not factor in the latest price-sensitive company announcements or qualitative material. Simply Wall St has no position in any stocks mentioned.
Have feedback on this article? Concerned about the content? Get in touch with us directly. Alternatively, email editorial-team@simplywallst.com
Contact Us
Contact Number : +852 3852 8500Service Email : service@webull.hkBusiness Cooperation : marketinghk@webull.hkWebull Securities Limited is licensed with the Securities and Futures Commission of Hong Kong (CE No. BNG700) for carrying out Type 1 License for Dealing in Securities, Type 2 License for Dealing in Futures Contracts and Type 4 License for Advising on Securities.

English