
Are TJX Shares Still Attractive After Recent Double Digit Gains in 2025?
Thinking about what to do with TJX Companies stock? You are not alone. In a market filled with headlines about inflation, shifting consumer habits, and ever-changing supply chains, TJX has managed to draw attention with its quietly robust performance, making it a staple for both value-seekers and growth-focused investors. The stock has climbed a staggering 176.5% over the past five years and risen another 18.1% in the last twelve months, a return that many in retail can only envy. Even in the past month, shares bumped up by 5.2%, reflecting investor optimism as the broader market recalibrates expectations around consumer resilience and discount retail’s expanding role.
However, if you are diving deeper and wondering if the stock offers real value at these levels, things get interesting. According to a common valuation framework that includes six checks to help determine whether a company is undervalued, TJX Companies currently scores a 0. In other words, it is not undervalued by any of these traditional measures. Still, the story does not end there. Let’s break down how these valuation checks work, and why understanding them is crucial before you make your next move on TJX. Also, if you stick with me, I will share a smarter and more comprehensive way to assess valuation at the end.
TJX Companies scores just 0/6 on our valuation checks. See what other red flags we found in the full valuation breakdown.Approach 1: TJX Companies Discounted Cash Flow (DCF) Analysis
A Discounted Cash Flow (DCF) model seeks to estimate the value of a company by projecting its future cash flows and discounting them back to today’s dollars. This process reflects both anticipated earnings and the risks associated with those projections. For TJX Companies, this method relies on detailed forecasts of the company’s ability to generate Free Cash Flow (FCF) over time.
Currently, TJX Companies generates approximately $4.05 billion in Free Cash Flow. Analyst estimates project that by 2030, annual FCF could reach roughly $5.76 billion. While forecasts from market analysts extend about five years, estimates for later years are extrapolated from historical trends and modest growth assumptions.
By applying the DCF model using the 2 Stage Free Cash Flow to Equity approach, the intrinsic value per share is calculated at $89.37. This is then compared to the current market price, revealing that TJX shares are 56.1% overvalued according to this framework. In summary, the market is pricing in stronger growth or a lower risk profile than conservative forecasts would justify.
Result: OVERVALUED
Head to the Valuation section of our Company Report for more details on how we arrive at this Fair Value for TJX Companies.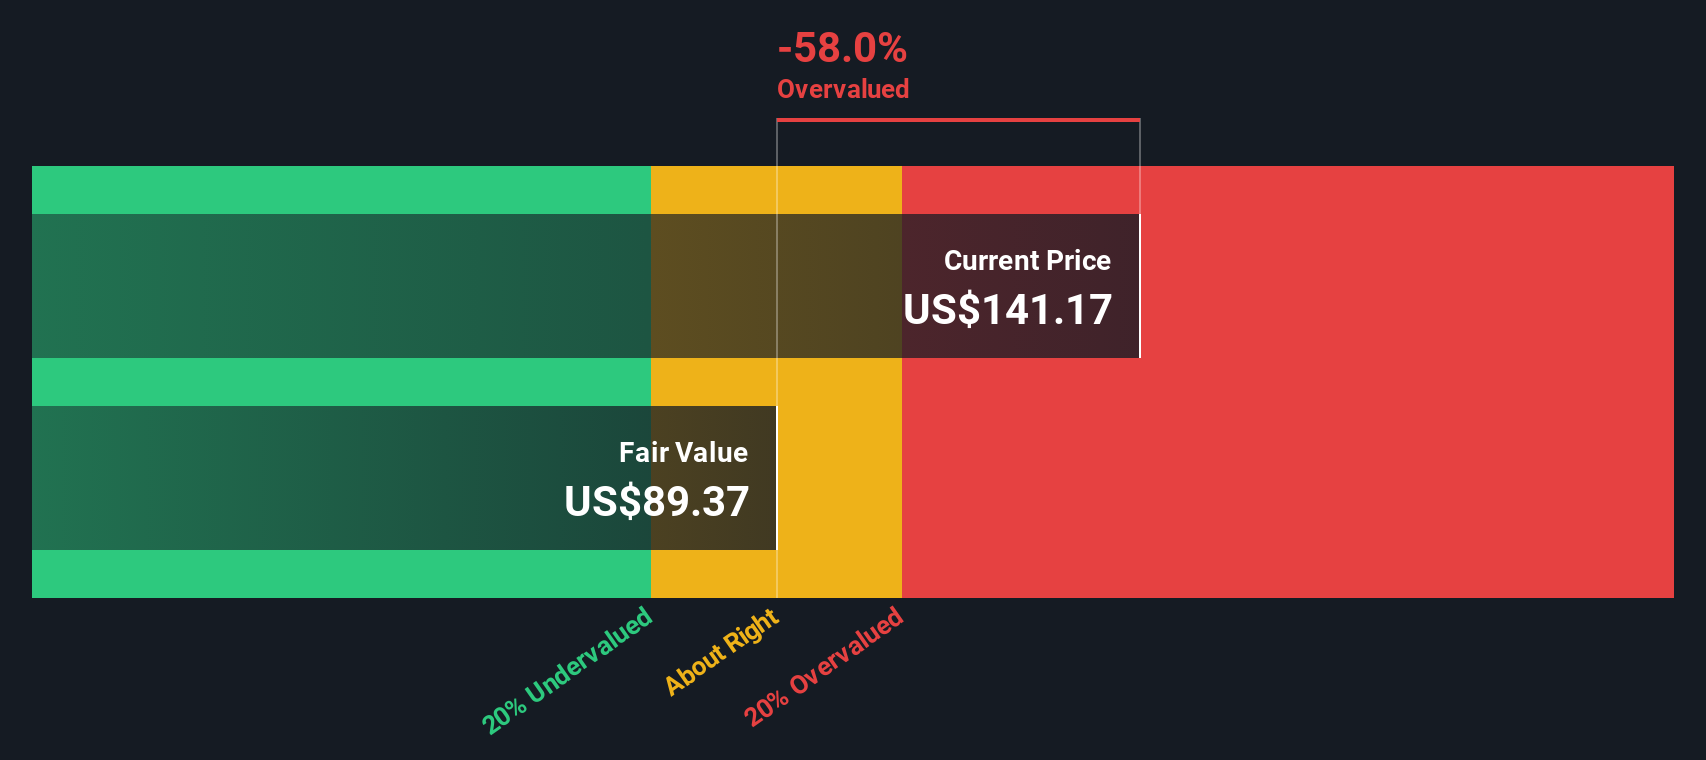
Approach 2: TJX Companies Price vs Earnings
For established and consistently profitable companies like TJX Companies, the Price-to-Earnings (PE) ratio is a widely favored valuation tool. It compares the company’s current share price to its per-share earnings, giving investors a quick sense of how much they are paying for ongoing profits. A “normal” or “fair” PE ratio can vary based on growth expectations and risk factors. Higher growth or lower risk typically justifies a higher multiple.
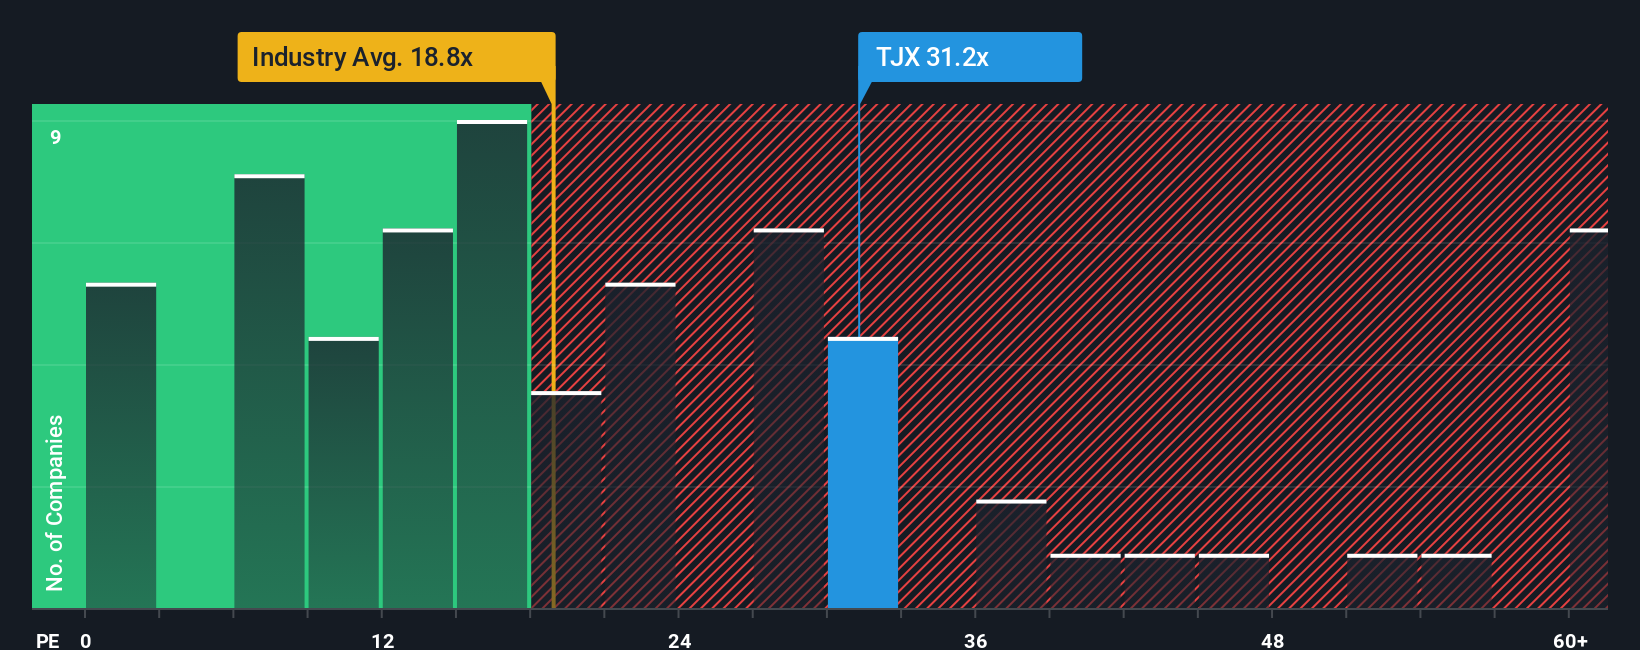
Right now, TJX Companies trades at a PE ratio of 31.2x, significantly above the specialty retail industry average of 18.7x and the peer group average of 19.0x. Benchmarks like these help show whether a company is priced at a premium or discount versus the broader sector, but they can miss important company-specific nuances.
That is where the Simply Wall St "Fair Ratio" comes in. The Fair Ratio for TJX is 21.7x, which is tailored for this company by factoring in its earnings growth, profit margins, market cap, sector profile, and risk. This approach gives a fuller picture than a simple comparison with peers or the industry because it actively adjusts for all the things that can impact a company’s long-term earnings potential.
With TJX currently trading at 31.2x earnings, well above its Fair Ratio of 21.7x, the stock looks expensive even after adjusting for growth and quality.
Result: OVERVALUED
Upgrade Your Decision Making: Choose your TJX Companies Narrative
Earlier we mentioned there is an even better way to understand valuation, so let's introduce you to Narratives. A Narrative is a simple yet powerful tool that lets you tell a story behind the numbers, combining your own view of a company’s future revenue, earnings, and margins with an estimated fair value. Narratives connect what you believe about TJX Companies to a real financial forecast and fair value, making your investment decision more personal and informed.
Accessible right on Simply Wall St’s Community page, Narratives are used by millions of investors to help decide when to buy or sell. To do this, compare your chosen Fair Value to the current Price and see where you stand. In addition, these perspectives update automatically as new news or earnings arrive, so your Narrative always reflects the latest information.
For example, some investors see TJX Companies' global expansion and higher customer engagement driving a fair value as high as $164, while others, concerned about risks to margins and competition, estimate a fair value closer to $88.
Do you think there's more to the story for TJX Companies? Create your own Narrative to let the Community know!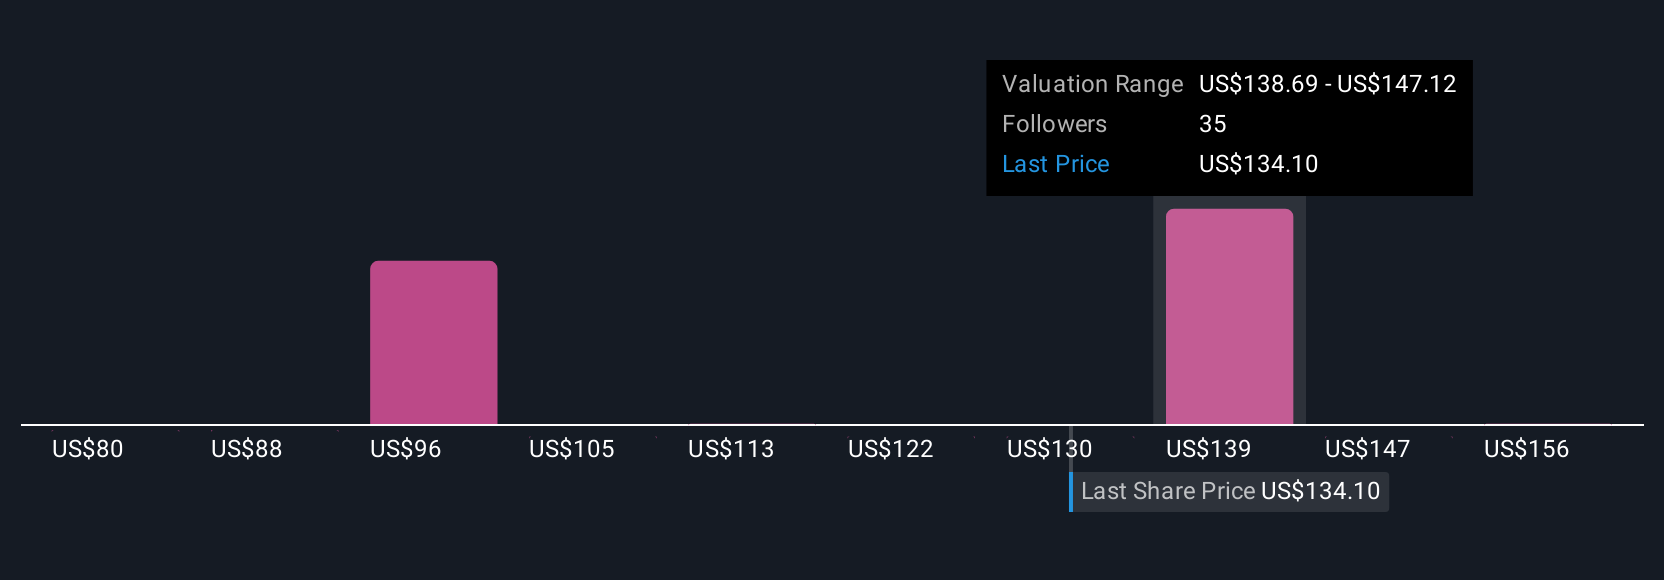
This article by Simply Wall St is general in nature. We provide commentary based on historical data and analyst forecasts only using an unbiased methodology and our articles are not intended to be financial advice. It does not constitute a recommendation to buy or sell any stock, and does not take account of your objectives, or your financial situation. We aim to bring you long-term focused analysis driven by fundamental data. Note that our analysis may not factor in the latest price-sensitive company announcements or qualitative material. Simply Wall St has no position in any stocks mentioned.
Have feedback on this article? Concerned about the content? Get in touch with us directly. Alternatively, email editorial-team@simplywallst.com
Contact Us
Contact Number : +852 3852 8500Service Email : service@webull.hkBusiness Cooperation : marketinghk@webull.hkWebull Securities Limited is licensed with the Securities and Futures Commission of Hong Kong (CE No. BNG700) for carrying out Type 1 License for Dealing in Securities, Type 2 License for Dealing in Futures Contracts and Type 4 License for Advising on Securities.

English