
Stock Of The Day: Will Occidental Petroleum Break Out Of Triangle Pattern?
Trading in Occidental Petroleum Corporation (NYSE:OXY) is quiet on Monday. But the stock is still in an uptrend and it may continue to remain in it.
A classic ascending triangle pattern has formed on the chart. This could have bullish implications, and it is why Occidental is the Stock of the Day.
Check out how OXY stock is currently doing here.
Many technical analysts don't understand the fundamental principles of the analysis. They mindlessly look for patterns on charts without understanding the price action and trading dynamics that cause them to form.
This is why technical analysis has a dubious reputation.
Chart patterns are not like reading tea leaves or astrology. If understood and applied correctly, technical analysis is the study of the supply and demand dynamics that are occurring in a given market.
Sometimes, when the leadership in a market is changing from bulls to bears or bears to bulls, the price action can manifest itself on the chart as a reversal pattern. These include rounded patterns, the head and shoulders, double or triple tops and bottoms, and reversal days.
Read Also: Musk’s Massive Tesla Stock Bet Recalls 2020—And A 400% Monster Rally
When it appears as though the current trend will continue, a continuation pattern may form. These include flags and triangle patterns.
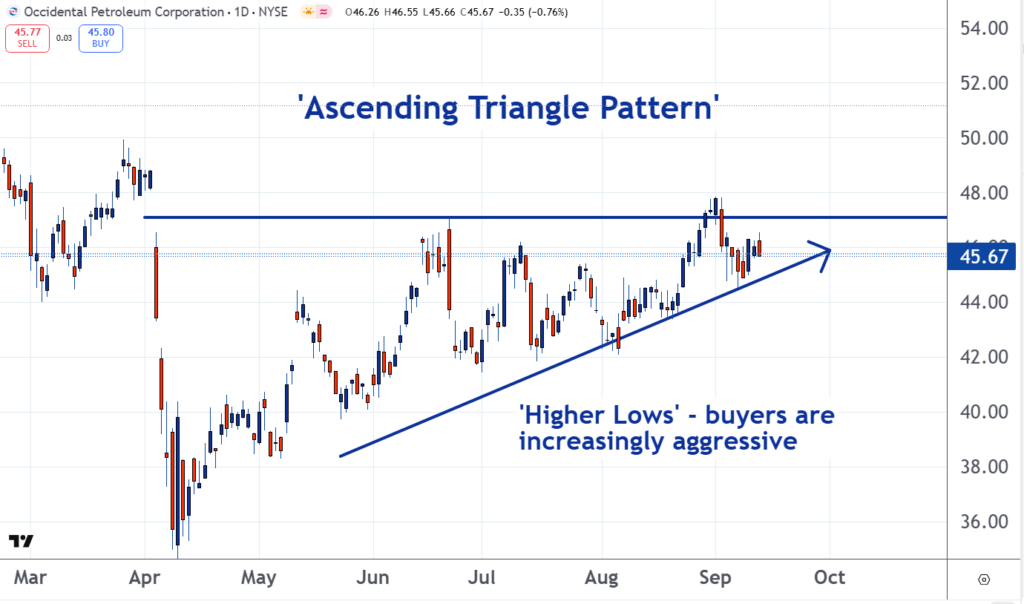
As you can see on the chart of Occidental, a classic ascending triangle pattern has formed. This typically has bullish implications.
The resistance line in the pattern is horizontal. This shows that as time passed, the traders and investors who created the resistance with their sell orders have been complacent. They have been willing to wait for the buyers to come to them.
If they do, they will sell. If not, they will be patient and remain at their price.
The support line is ascending. This shows that as time passed, the buyers have become increasingly aggressive. They have been willing to enter the market at higher prices.
If understood and applied correctly, technical analysis is the study of supply and demand in a market. The ascending triangle pattern is bullish because it shows a market with aggressive buyers and patient sellers.
These dynamics could set the stage for a move higher in Occidental.
Read Next:
• Trump Says Quarterly Earnings Are ‘Not Good’ — Here’s What He Wants Instead
Photo: Shutterstock
Contact Us
Contact Number : +852 3852 8500Service Email : service@webull.hkBusiness Cooperation : marketinghk@webull.hkWebull Securities Limited is licensed with the Securities and Futures Commission of Hong Kong (CE No. BNG700) for carrying out Type 1 License for Dealing in Securities, Type 2 License for Dealing in Futures Contracts and Type 4 License for Advising on Securities.

English