
Asian Stocks Trading Below Estimated Value In September 2025
As global markets navigate the anticipation of interest rate cuts and the ongoing AI boom, Asian markets are also experiencing shifts in investor sentiment. With Japan's stock indices on the rise and China's markets buoyed by domestic liquidity, investors are increasingly focused on identifying stocks trading below their estimated value. In such an environment, a good stock is often characterized by strong fundamentals that may not yet be fully recognized in its current market price, offering potential opportunities for value-seeking investors.
Top 10 Undervalued Stocks Based On Cash Flows In Asia
| Name | Current Price | Fair Value (Est) | Discount (Est) |
| Zhejiang Century Huatong GroupLtd (SZSE:002602) | CN¥19.30 | CN¥38.03 | 49.3% |
| Taiyo Yuden (TSE:6976) | ¥3264.00 | ¥6300.07 | 48.2% |
| Suzhou Alton Electrical & Mechanical Industry (SZSE:301187) | CN¥30.30 | CN¥58.46 | 48.2% |
| SRE Holdings (TSE:2980) | ¥3330.00 | ¥6404.79 | 48% |
| Pansoft (SZSE:300996) | CN¥17.09 | CN¥33.96 | 49.7% |
| Kolmar Korea (KOSE:A161890) | ₩80300.00 | ₩155585.80 | 48.4% |
| Inspur Digital Enterprise Technology (SEHK:596) | HK$9.71 | HK$18.94 | 48.7% |
| Guangdong Marubi Biotechnology (SHSE:603983) | CN¥39.90 | CN¥77.58 | 48.6% |
| Faraday Technology (TWSE:3035) | NT$153.50 | NT$300.64 | 48.9% |
| Anhui Ronds Science & Technology (SHSE:688768) | CN¥49.09 | CN¥97.21 | 49.5% |
Let's take a closer look at a couple of our picks from the screened companies.
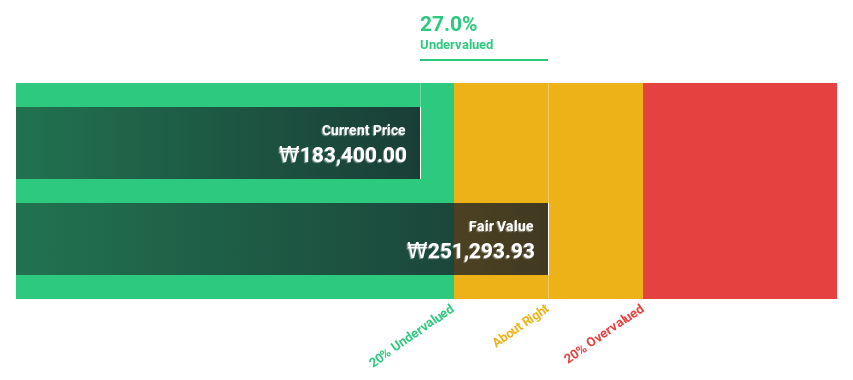
Cosmax (KOSE:A192820)
Overview: Cosmax, Inc. is a company that researches, develops, produces, and manufactures cosmetic and health functional food products both in Korea and internationally with a market cap of ₩2.63 trillion.
Operations: The company's revenue primarily comes from the Cosmetics Sector, which generated approximately ₩2.30 trillion.
Estimated Discount To Fair Value: 44.9%
Cosmax is trading at ₩231,500, significantly below its estimated fair value of ₩420,145.45. Despite high non-cash earnings and a volatile share price recently, the company's earnings are expected to grow at 41.4% annually—well above the Korean market average of 23.2%. However, concerns exist as debt isn't well covered by operating cash flow. Analysts agree on a potential stock price rise of 24%, highlighting its undervaluation based on cash flows.
- Our growth report here indicates Cosmax may be poised for an improving outlook.
- Navigate through the intricacies of Cosmax with our comprehensive financial health report here.
East Buy Holding (SEHK:1797)
Overview: East Buy Holding Limited is an investment holding company that operates in the livestreaming e-commerce sector in the People's Republic of China, with a market cap of HK$28.37 billion.
Operations: The company generates revenue of CN¥4.39 billion from its online live commerce business in the People's Republic of China.
Estimated Discount To Fair Value: 29.3%
East Buy Holding is trading at HK$26.92, significantly below its fair value estimate of HK$38.05, indicating it may be undervalued based on cash flows. Although profit margins have decreased from 3.8% to 0.1%, earnings are projected to grow substantially at 58.6% annually, outpacing the Hong Kong market's growth rate of 12.4%. Despite recent volatility and large one-off items affecting results, the company has renewed a key agreement with New Oriental Group, potentially boosting future revenues.
- The growth report we've compiled suggests that East Buy Holding's future prospects could be on the up.
- Click to explore a detailed breakdown of our findings in East Buy Holding's balance sheet health report.

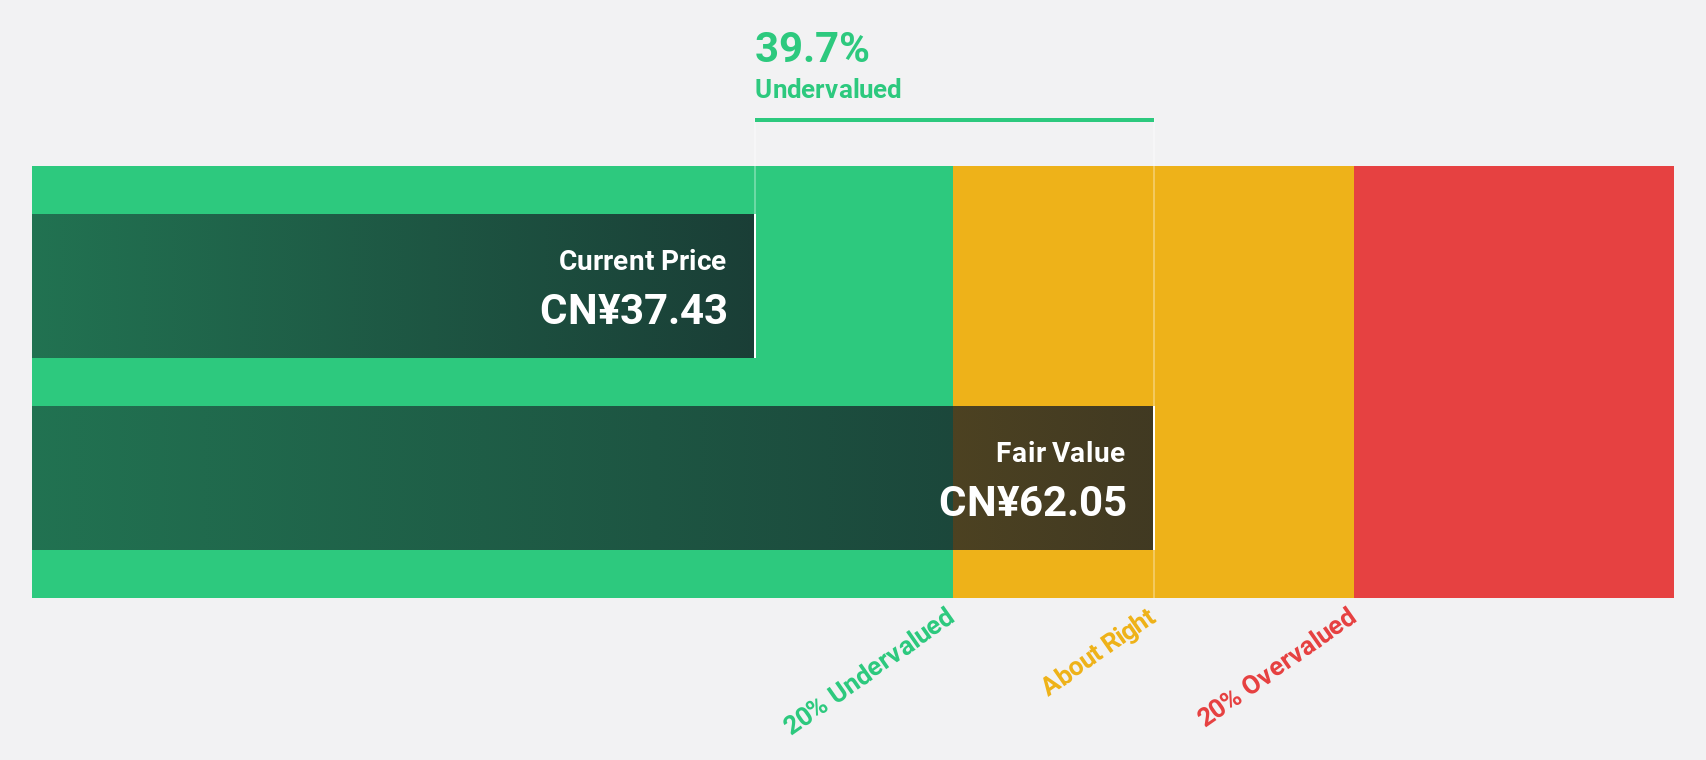
Ficont Industry (Beijing) (SHSE:605305)
Overview: Ficont Industry (Beijing) Co., Ltd. specializes in wind energy, construction, and safety protection equipment both in China and internationally, with a market cap of CN¥8.88 billion.
Operations: The company's revenue from construction machinery and equipment is CN¥1.55 billion.
Estimated Discount To Fair Value: 33%
Ficont Industry (Beijing) is trading at CN¥41.79, well below its fair value estimate of CN¥62.36, highlighting a potential undervaluation based on cash flows. The company reported a significant earnings increase of 64.4% over the past year and forecasts suggest continued annual profit growth of 22%. However, despite strong revenue growth projections exceeding market averages, the return on equity remains relatively low at an expected 18.9% in three years.
- According our earnings growth report, there's an indication that Ficont Industry (Beijing) might be ready to expand.
- Take a closer look at Ficont Industry (Beijing)'s balance sheet health here in our report.
Where To Now?
- Embark on your investment journey to our 273 Undervalued Asian Stocks Based On Cash Flows selection here.
- Are any of these part of your asset mix? Tap into the analytical power of Simply Wall St's portfolio to get a 360-degree view on how they're shaping up.
- Simply Wall St is your key to unlocking global market trends, a free user-friendly app for forward-thinking investors.
Ready For A Different Approach?
- Explore high-performing small cap companies that haven't yet garnered significant analyst attention.
- Diversify your portfolio with solid dividend payers offering reliable income streams to weather potential market turbulence.
- Fuel your portfolio with companies showing strong growth potential, backed by optimistic outlooks both from analysts and management.
This article by Simply Wall St is general in nature. We provide commentary based on historical data and analyst forecasts only using an unbiased methodology and our articles are not intended to be financial advice. It does not constitute a recommendation to buy or sell any stock, and does not take account of your objectives, or your financial situation. We aim to bring you long-term focused analysis driven by fundamental data. Note that our analysis may not factor in the latest price-sensitive company announcements or qualitative material. Simply Wall St has no position in any stocks mentioned.
Have feedback on this article? Concerned about the content? Get in touch with us directly. Alternatively, email editorial-team@simplywallst.com
Contact Us
Contact Number :+852 3852 8500Webull Securities Limited is licensed with the Securities and Futures Commission of Hong Kong (CE No. BNG700) for carrying out Type 1 License for Dealing in Securities, Type 2 License for Dealing in Futures Contracts and Type 4 License for Advising on Securities.

English