
Xinji Shaxi Group Co., Ltd's (HKG:3603) 26% Share Price Plunge Could Signal Some Risk
Xinji Shaxi Group Co., Ltd (HKG:3603) shares have had a horrible month, losing 26% after a relatively good period beforehand. The drop over the last 30 days has capped off a tough year for shareholders, with the share price down 13% in that time.
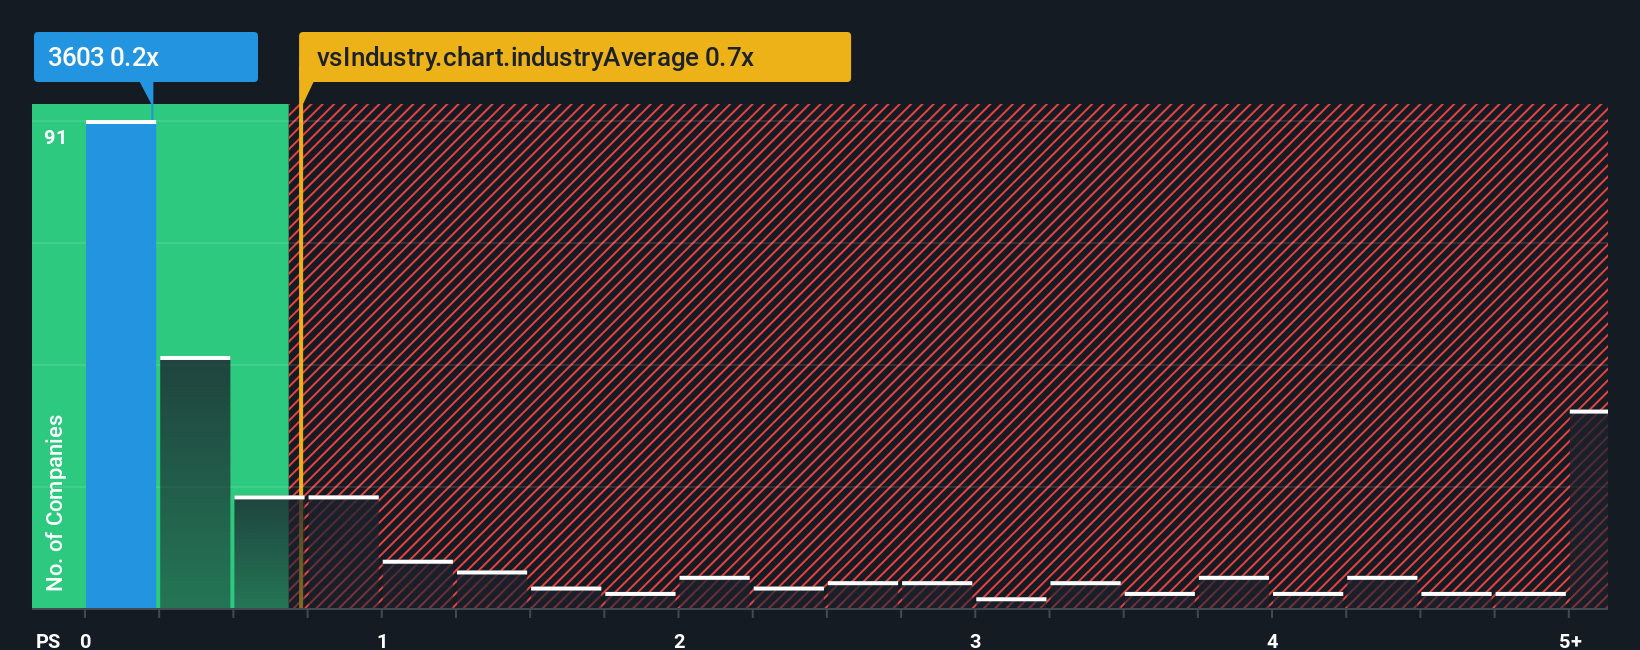
In spite of the heavy fall in price, it's still not a stretch to say that Xinji Shaxi Group's price-to-sales (or "P/S") ratio of 0.2x right now seems quite "middle-of-the-road" compared to the Real Estate industry in Hong Kong, where the median P/S ratio is around 0.7x. However, investors might be overlooking a clear opportunity or potential setback if there is no rational basis for the P/S.
Check out our latest analysis for Xinji Shaxi Group
What Does Xinji Shaxi Group's P/S Mean For Shareholders?
For example, consider that Xinji Shaxi Group's financial performance has been poor lately as its revenue has been in decline. It might be that many expect the company to put the disappointing revenue performance behind them over the coming period, which has kept the P/S from falling. If not, then existing shareholders may be a little nervous about the viability of the share price.
Although there are no analyst estimates available for Xinji Shaxi Group, take a look at this free data-rich visualisation to see how the company stacks up on earnings, revenue and cash flow.Is There Some Revenue Growth Forecasted For Xinji Shaxi Group?
Xinji Shaxi Group's P/S ratio would be typical for a company that's only expected to deliver moderate growth, and importantly, perform in line with the industry.
In reviewing the last year of financials, we were disheartened to see the company's revenues fell to the tune of 12%. This means it has also seen a slide in revenue over the longer-term as revenue is down 18% in total over the last three years. So unfortunately, we have to acknowledge that the company has not done a great job of growing revenue over that time.
Weighing that medium-term revenue trajectory against the broader industry's one-year forecast for expansion of 5.3% shows it's an unpleasant look.
With this in mind, we find it worrying that Xinji Shaxi Group's P/S exceeds that of its industry peers. Apparently many investors in the company are way less bearish than recent times would indicate and aren't willing to let go of their stock right now. There's a good chance existing shareholders are setting themselves up for future disappointment if the P/S falls to levels more in line with the recent negative growth rates.
What We Can Learn From Xinji Shaxi Group's P/S?
Following Xinji Shaxi Group's share price tumble, its P/S is just clinging on to the industry median P/S. Typically, we'd caution against reading too much into price-to-sales ratios when settling on investment decisions, though it can reveal plenty about what other market participants think about the company.
We find it unexpected that Xinji Shaxi Group trades at a P/S ratio that is comparable to the rest of the industry, despite experiencing declining revenues during the medium-term, while the industry as a whole is expected to grow. When we see revenue heading backwards in the context of growing industry forecasts, it'd make sense to expect a possible share price decline on the horizon, sending the moderate P/S lower. If recent medium-term revenue trends continue, it will place shareholders' investments at risk and potential investors in danger of paying an unnecessary premium.
We don't want to rain on the parade too much, but we did also find 3 warning signs for Xinji Shaxi Group (2 are a bit unpleasant!) that you need to be mindful of.
It's important to make sure you look for a great company, not just the first idea you come across. So if growing profitability aligns with your idea of a great company, take a peek at this free list of interesting companies with strong recent earnings growth (and a low P/E).
Have feedback on this article? Concerned about the content? Get in touch with us directly. Alternatively, email editorial-team (at) simplywallst.com.
This article by Simply Wall St is general in nature. We provide commentary based on historical data and analyst forecasts only using an unbiased methodology and our articles are not intended to be financial advice. It does not constitute a recommendation to buy or sell any stock, and does not take account of your objectives, or your financial situation. We aim to bring you long-term focused analysis driven by fundamental data. Note that our analysis may not factor in the latest price-sensitive company announcements or qualitative material. Simply Wall St has no position in any stocks mentioned.
Contact Us
Contact Number :+852 3852 8500Webull Securities Limited is licensed with the Securities and Futures Commission of Hong Kong (CE No. BNG700) for carrying out Type 1 License for Dealing in Securities, Type 2 License for Dealing in Futures Contracts and Type 4 License for Advising on Securities.

English