
China In-Tech Limited's (HKG:464) largest shareholders are private companies who were rewarded as market cap surged HK$205m last week
Key Insights
- Significant control over China In-Tech by private companies implies that the general public has more power to influence management and governance-related decisions
- The top 2 shareholders own 51% of the company
- Insiders have been buying lately
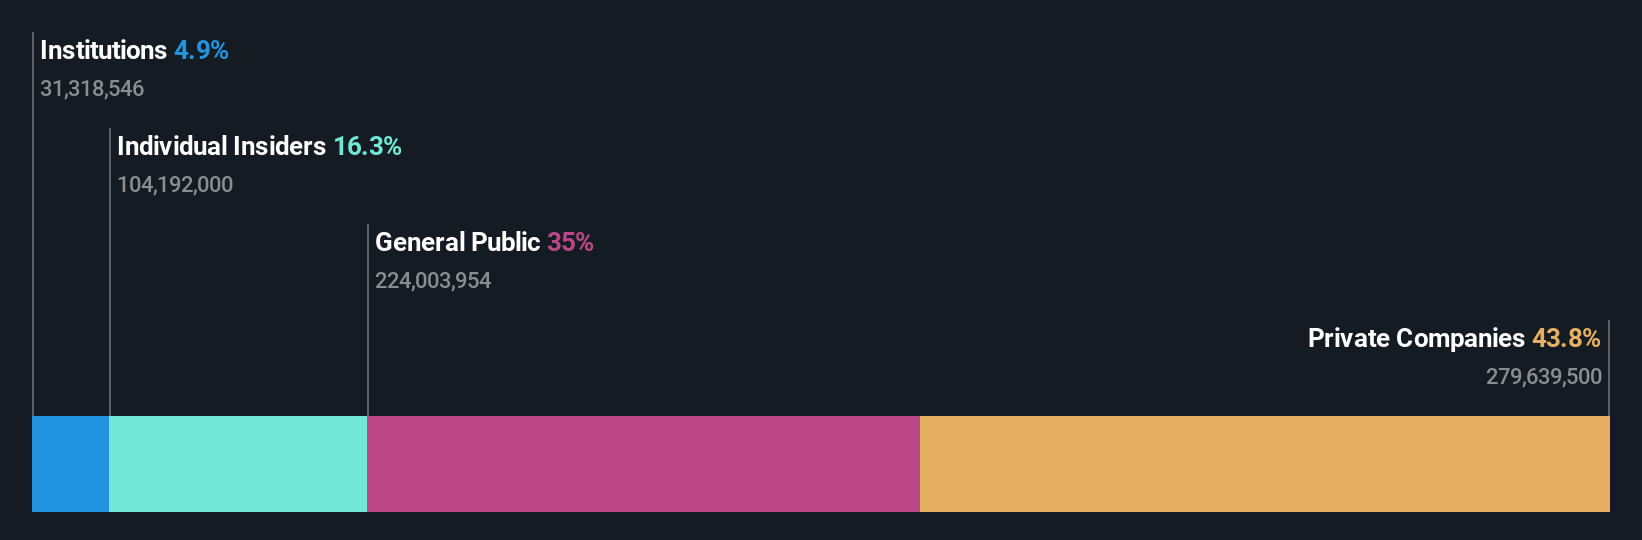
If you want to know who really controls China In-Tech Limited (HKG:464), then you'll have to look at the makeup of its share registry. With 44% stake, private companies possess the maximum shares in the company. Put another way, the group faces the maximum upside potential (or downside risk).
As a result, private companies collectively scored the highest last week as the company hit HK$780m market cap following a 36% gain in the stock.
In the chart below, we zoom in on the different ownership groups of China In-Tech.
Check out our latest analysis for China In-Tech
What Does The Institutional Ownership Tell Us About China In-Tech?
Many institutions measure their performance against an index that approximates the local market. So they usually pay more attention to companies that are included in major indices.
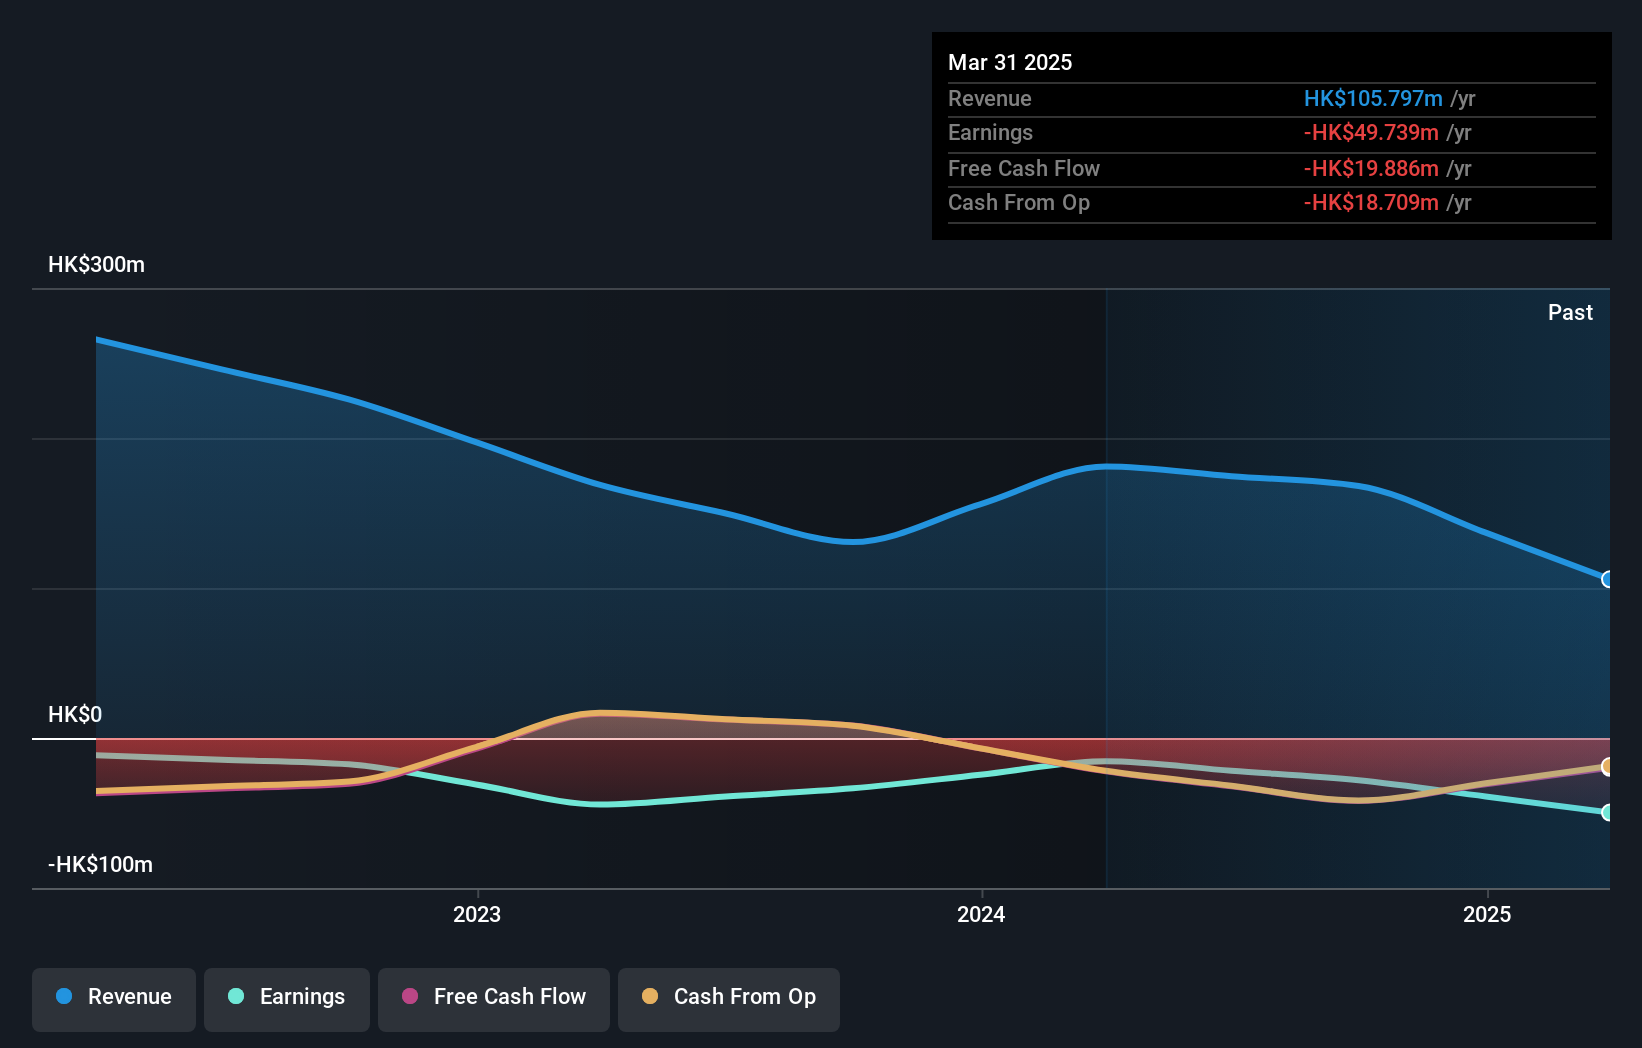
Since institutions own only a small portion of China In-Tech, many may not have spent much time considering the stock. But it's clear that some have; and they liked it enough to buy in. If the business gets stronger from here, we could see a situation where more institutions are keen to buy. We sometimes see a rising share price when a few big institutions want to buy a certain stock at the same time. The history of earnings and revenue, which you can see below, could be helpful in considering if more institutional investors will want the stock. Of course, there are plenty of other factors to consider, too.
Hedge funds don't have many shares in China In-Tech. Luckever Holdings Limited is currently the largest shareholder, with 39% of shares outstanding. Hung Shun Ma is the second largest shareholder owning 11% of common stock, and Tianjin Yitongyuan Asset Management Co., Ltd. holds about 4.9% of the company stock.
To make our study more interesting, we found that the top 2 shareholders have a majority ownership in the company, meaning that they are powerful enough to influence the decisions of the company.
While it makes sense to study institutional ownership data for a company, it also makes sense to study analyst sentiments to know which way the wind is blowing. Our information suggests that there isn't any analyst coverage of the stock, so it is probably little known.
Insider Ownership Of China In-Tech
The definition of company insiders can be subjective and does vary between jurisdictions. Our data reflects individual insiders, capturing board members at the very least. The company management answer to the board and the latter should represent the interests of shareholders. Notably, sometimes top-level managers are on the board themselves.
Insider ownership is positive when it signals leadership are thinking like the true owners of the company. However, high insider ownership can also give immense power to a small group within the company. This can be negative in some circumstances.
Our most recent data indicates that insiders own a reasonable proportion of China In-Tech Limited. It has a market capitalization of just HK$780m, and insiders have HK$127m worth of shares in their own names. It is great to see insiders so invested in the business. It might be worth checking if those insiders have been buying recently.
General Public Ownership
The general public-- including retail investors -- own 35% stake in the company, and hence can't easily be ignored. This size of ownership, while considerable, may not be enough to change company policy if the decision is not in sync with other large shareholders.
Private Company Ownership
Our data indicates that Private Companies hold 44%, of the company's shares. Private companies may be related parties. Sometimes insiders have an interest in a public company through a holding in a private company, rather than in their own capacity as an individual. While it's hard to draw any broad stroke conclusions, it is worth noting as an area for further research.
Next Steps:
I find it very interesting to look at who exactly owns a company. But to truly gain insight, we need to consider other information, too. For example, we've discovered 4 warning signs for China In-Tech (2 don't sit too well with us!) that you should be aware of before investing here.
Of course this may not be the best stock to buy. So take a peek at this free free list of interesting companies.
NB: Figures in this article are calculated using data from the last twelve months, which refer to the 12-month period ending on the last date of the month the financial statement is dated. This may not be consistent with full year annual report figures.
Have feedback on this article? Concerned about the content? Get in touch with us directly. Alternatively, email editorial-team (at) simplywallst.com.
This article by Simply Wall St is general in nature. We provide commentary based on historical data and analyst forecasts only using an unbiased methodology and our articles are not intended to be financial advice. It does not constitute a recommendation to buy or sell any stock, and does not take account of your objectives, or your financial situation. We aim to bring you long-term focused analysis driven by fundamental data. Note that our analysis may not factor in the latest price-sensitive company announcements or qualitative material. Simply Wall St has no position in any stocks mentioned.
Contact Us
Contact Number : +852 3852 8500Service Email : service@webull.hkBusiness Cooperation : marketinghk@webull.hkWebull Securities Limited is licensed with the Securities and Futures Commission of Hong Kong (CE No. BNG700) for carrying out Type 1 License for Dealing in Securities, Type 2 License for Dealing in Futures Contracts and Type 4 License for Advising on Securities.

English