
Little Excitement Around JW (Cayman) Therapeutics Co. Ltd's (HKG:2126) Revenues As Shares Take 25% Pounding
The JW (Cayman) Therapeutics Co. Ltd (HKG:2126) share price has softened a substantial 25% over the previous 30 days, handing back much of the gains the stock has made lately. Of course, over the longer-term many would still wish they owned shares as the stock's price has soared 139% in the last twelve months.
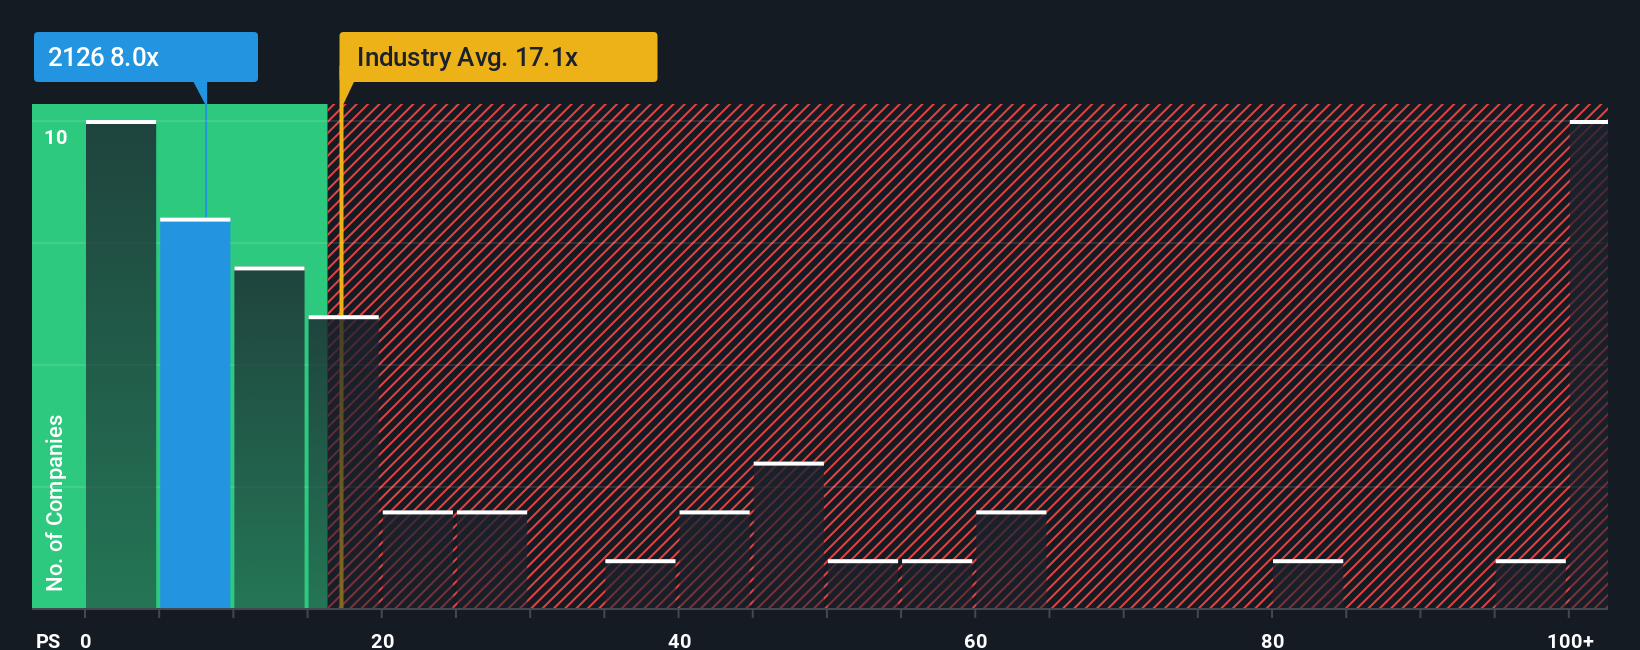
Following the heavy fall in price, JW (Cayman) Therapeutics' price-to-sales (or "P/S") ratio of 8x might make it look like a strong buy right now compared to the wider Biotechs industry in Hong Kong, where around half of the companies have P/S ratios above 17.1x and even P/S above 69x are quite common. However, the P/S might be quite low for a reason and it requires further investigation to determine if it's justified.
View our latest analysis for JW (Cayman) Therapeutics
What Does JW (Cayman) Therapeutics' P/S Mean For Shareholders?
With revenue growth that's inferior to most other companies of late, JW (Cayman) Therapeutics has been relatively sluggish. The P/S ratio is probably low because investors think this lacklustre revenue performance isn't going to get any better. If this is the case, then existing shareholders will probably struggle to get excited about the future direction of the share price.
Keen to find out how analysts think JW (Cayman) Therapeutics' future stacks up against the industry? In that case, our free report is a great place to start.What Are Revenue Growth Metrics Telling Us About The Low P/S?
JW (Cayman) Therapeutics' P/S ratio would be typical for a company that's expected to deliver very poor growth or even falling revenue, and importantly, perform much worse than the industry.
If we review the last year of revenue growth, the company posted a worthy increase of 2.8%. Pleasingly, revenue has also lifted 84% in aggregate from three years ago, partly thanks to the last 12 months of growth. Accordingly, shareholders would have definitely welcomed those medium-term rates of revenue growth.
Turning to the outlook, the next three years should generate growth of 39% per annum as estimated by the sole analyst watching the company. Meanwhile, the rest of the industry is forecast to expand by 95% per year, which is noticeably more attractive.
With this information, we can see why JW (Cayman) Therapeutics is trading at a P/S lower than the industry. Apparently many shareholders weren't comfortable holding on while the company is potentially eyeing a less prosperous future.
The Final Word
Having almost fallen off a cliff, JW (Cayman) Therapeutics' share price has pulled its P/S way down as well. Generally, our preference is to limit the use of the price-to-sales ratio to establishing what the market thinks about the overall health of a company.
As expected, our analysis of JW (Cayman) Therapeutics' analyst forecasts confirms that the company's underwhelming revenue outlook is a major contributor to its low P/S. At this stage investors feel the potential for an improvement in revenue isn't great enough to justify a higher P/S ratio. It's hard to see the share price rising strongly in the near future under these circumstances.
There are also other vital risk factors to consider and we've discovered 2 warning signs for JW (Cayman) Therapeutics (1 is a bit unpleasant!) that you should be aware of before investing here.
It's important to make sure you look for a great company, not just the first idea you come across. So if growing profitability aligns with your idea of a great company, take a peek at this free list of interesting companies with strong recent earnings growth (and a low P/E).
Have feedback on this article? Concerned about the content? Get in touch with us directly. Alternatively, email editorial-team (at) simplywallst.com.
This article by Simply Wall St is general in nature. We provide commentary based on historical data and analyst forecasts only using an unbiased methodology and our articles are not intended to be financial advice. It does not constitute a recommendation to buy or sell any stock, and does not take account of your objectives, or your financial situation. We aim to bring you long-term focused analysis driven by fundamental data. Note that our analysis may not factor in the latest price-sensitive company announcements or qualitative material. Simply Wall St has no position in any stocks mentioned.
Contact Us
Contact Number :+852 3852 8500Webull Securities Limited is licensed with the Securities and Futures Commission of Hong Kong (CE No. BNG700) for carrying out Type 1 License for Dealing in Securities, Type 2 License for Dealing in Futures Contracts and Type 4 License for Advising on Securities.

English