
SolarEdge’s 7% Weekly Surge Sparks Fresh Debate on True Value After New European Partnerships
If you’ve been keeping an eye on SolarEdge Technologies, you’re not alone. With the stock’s wild ride, from massive multi-year declines to a 7.2% pop this past week, the big question for most investors is clear: should you hold tight, double down, or move on? Despite years of pretty dramatic losses, most notably the huge drop of nearly 83% over three years and 85% over five, recent months are telling a different story. SolarEdge has bounced 6% in the past month and sits a staggering 168% higher year-to-date, pointing to shifting sentiment and perhaps a change in risk perception.
What’s behind this turnaround? In the past few months, the company has made headlines for securing new supply chain contracts and deepening partnerships across Europe. This signals resilience amid industry headwinds. This renewed optimism is catching the market’s attention, which is a crucial backdrop when we think about valuation.
For the number-crunchers out there, SolarEdge currently clocks a value score of 4 out of 6, meaning it looks undervalued according to four of the major metrics analysts track. That is impressive in a sector that often trades on hype or momentum.
There are plenty of ways to slice the valuation pie, and some are more telling than others. Next, we’ll break down how those classic approaches stack up for SolarEdge. Keep reading to see why a broader view might give you an even clearer answer.
Approach 1: SolarEdge Technologies Discounted Cash Flow (DCF) Analysis
A Discounted Cash Flow (DCF) model projects a company's future cash flows and discounts them back to today’s value. This gives investors a way to estimate what the business is really worth right now. It is a method often used to look past the noise and focus on long-term performance.
For SolarEdge Technologies, the latest data shows the company had a trailing twelve-month Free Cash Flow (FCF) of -$85.2 million. Analysts expect this to turn around significantly, projecting positive and growing cash flows over the next decade, reaching $448.2 million by 2029. Simply Wall St has extrapolated further, estimating that FCF may continue rising to over $936 million by 2035, although these further-out projections carry more uncertainty. All values are in US dollars.
Based on these projections and after all expected future cash flows are discounted to the present, the DCF model calculates an intrinsic value of $69.46 per share. Currently, the stock trades at a discount of 42.8% to this estimated worth. This suggests SolarEdge could offer significant upside from current levels.
Result: UNDERVALUED
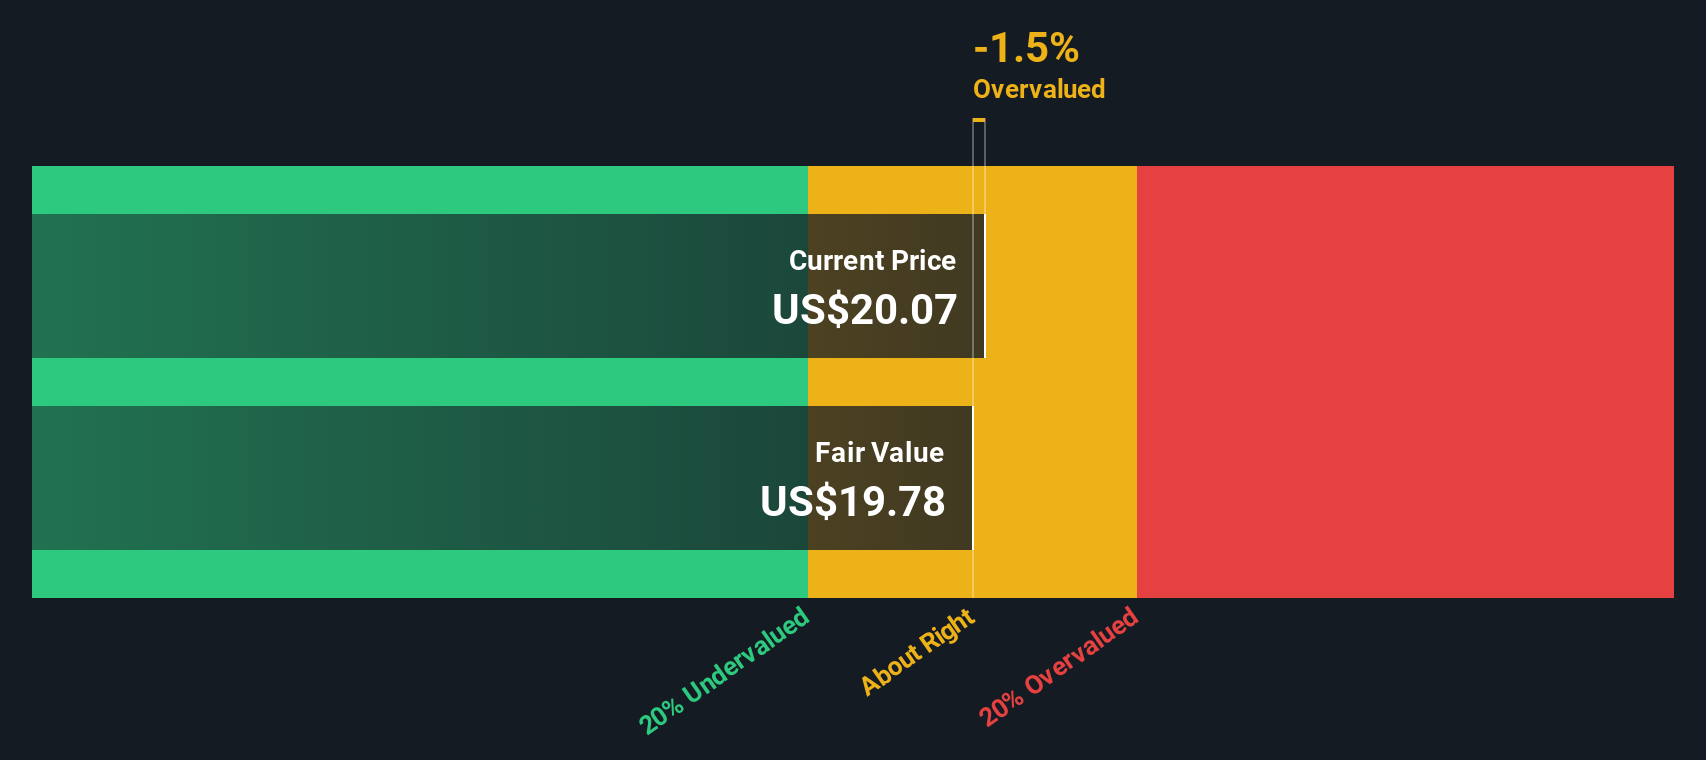
Our Discounted Cash Flow (DCF) analysis suggests SolarEdge Technologies is undervalued by 42.8%. Track this in your watchlist or portfolio, or discover more undervalued stocks.
Approach 2: SolarEdge Technologies Price vs Sales
Another widely used approach to valuing companies, especially those that are not currently profitable, is to use the Price-to-Sales (P/S) ratio. For companies like SolarEdge Technologies, which have recently faced negative earnings but still maintain substantial revenue, the P/S multiple often provides a more stable lens for valuation compared to Price-to-Earnings or Price-to-Book. It offers insight into how much investors are willing to pay for every dollar of sales, which is particularly relevant in growth-oriented sectors like semiconductors.
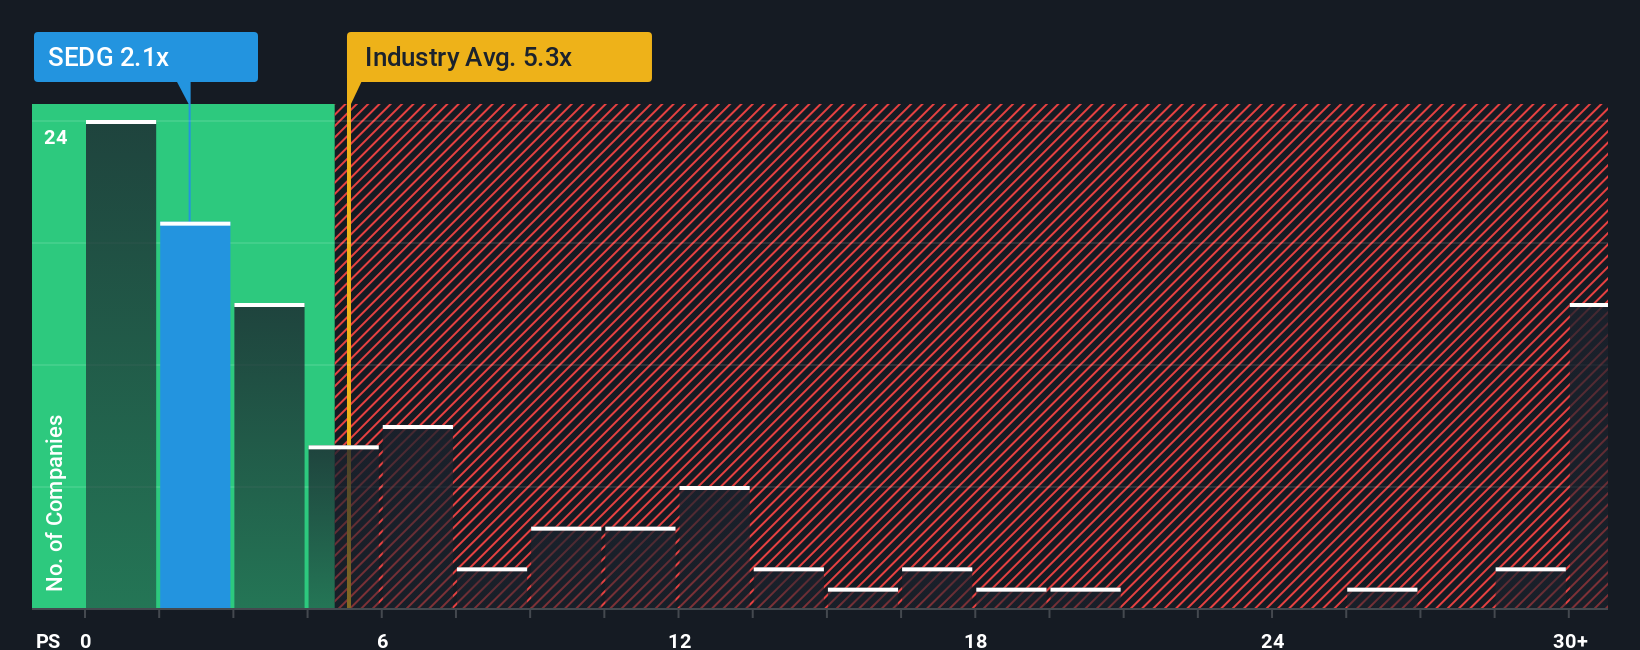
The “right” P/S ratio is shaped by expectations for future growth, profitability, and perceived risk. Higher growth prospects and strong margins usually justify a higher multiple, while greater risks or industry headwinds might push it lower. For SolarEdge, its current P/S ratio stands at 2.5x. This is well below the semiconductor industry average of 5.28x and also trails the typical peer at 2.94x. On this surface-level comparison, SolarEdge looks like a relative bargain.
However, not all companies within an industry deserve the same multiple. Simply Wall St’s proprietary “Fair Ratio” goes a step further by factoring in SolarEdge’s unique profile, including its projected growth, profit margins, risks, and its position in the market. For SolarEdge, this Fair Ratio comes out to 0.26x. This is significantly lower than its current multiple, suggesting that even against the company’s own fundamentals and risk factors, the market is currently valuing the stock too highly on a sales basis compared to what would be considered fair for SolarEdge specifically. This kind of tailored analysis helps investors avoid broad-brush comparisons and focus on whether a company truly deserves a premium or discount.
Result: OVERVALUED
PS ratios tell one story, but what if the real opportunity lies elsewhere? Discover companies where insiders are betting big on explosive growth.
Upgrade Your Decision Making: Choose your SolarEdge Technologies Narrative
Earlier we mentioned there is an even better way to understand valuation, so let’s introduce you to Narratives. Narratives offer a smarter investing approach, allowing you to create and compare stories about a company’s future that connect real-world opportunities or risks with concrete financial forecasts and fair value estimates. Instead of relying only on ratios or analyst targets, Narratives give every investor a clear, customized path by tying your unique perspective (such as assumptions about future sales, earnings, and margins) to what you think the stock is really worth.
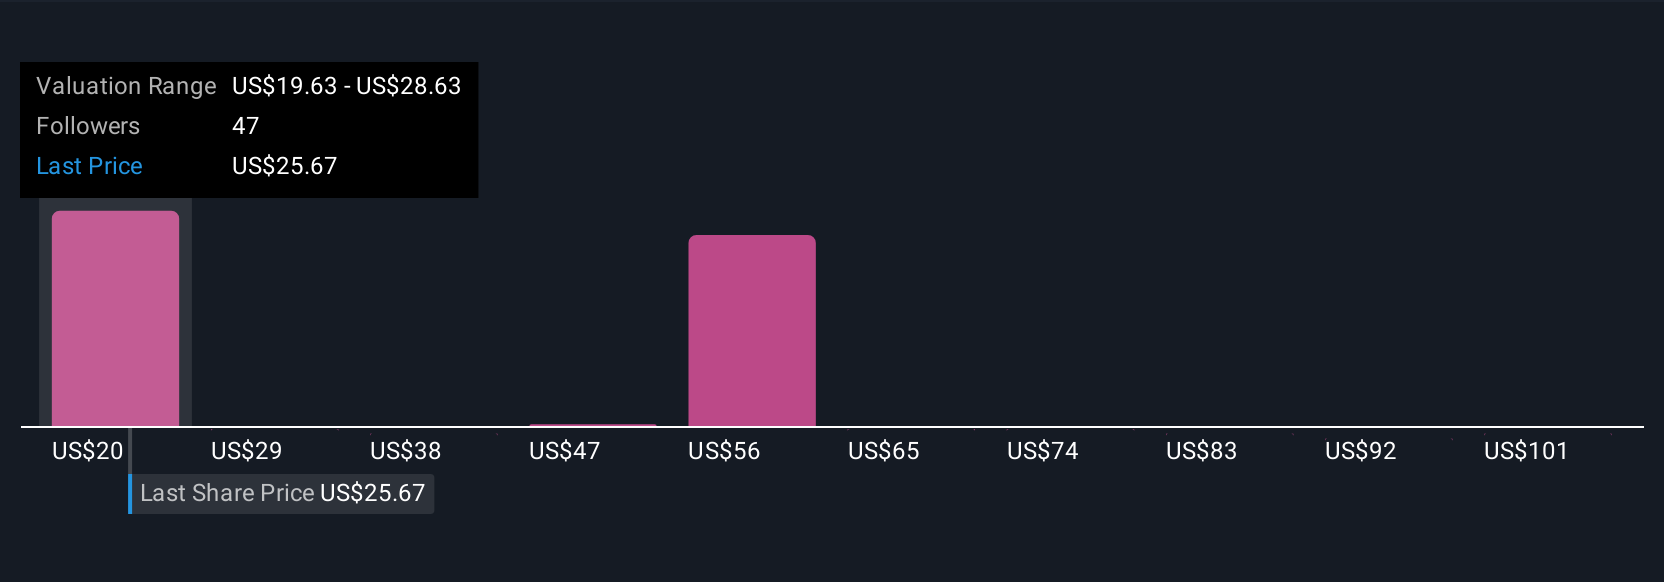
On Simply Wall St’s Community page, millions of investors are already building Narratives to determine whether a company is undervalued or overvalued, and to decide when to buy or sell by tracking the gap between their calculated fair value and the current price. These Narratives update automatically with new news or earnings, so your view reflects the latest information. For SolarEdge Technologies, you will see different investors arrive at wildly different conclusions: the most bullish expect a fair value as high as $35 per share, while the most cautious see only $7 per share. This clearly shows how Narratives turn numbers into actionable insight.
Do you think there's more to the story for SolarEdge Technologies? Create your own Narrative to let the Community know!
This article by Simply Wall St is general in nature. We provide commentary based on historical data and analyst forecasts only using an unbiased methodology and our articles are not intended to be financial advice. It does not constitute a recommendation to buy or sell any stock, and does not take account of your objectives, or your financial situation. We aim to bring you long-term focused analysis driven by fundamental data. Note that our analysis may not factor in the latest price-sensitive company announcements or qualitative material. Simply Wall St has no position in any stocks mentioned.
Have feedback on this article? Concerned about the content? Get in touch with us directly. Alternatively, email editorial-team@simplywallst.com
Contact Us
Contact Number : +852 3852 8500Service Email : service@webull.hkBusiness Cooperation : marketinghk@webull.hkWebull Securities Limited is licensed with the Securities and Futures Commission of Hong Kong (CE No. BNG700) for carrying out Type 1 License for Dealing in Securities, Type 2 License for Dealing in Futures Contracts and Type 4 License for Advising on Securities.

English