
Visteon (VC): Assessing Valuation Following Recent Share Price Movements
Visteon (VC) has captured market attention lately, particularly after its recent share price movements. Investors are comparing the company’s performance with broader trends in the automotive sector to assess its potential in the months ahead.
See our latest analysis for Visteon.
After a strong start to the year, Visteon's momentum has cooled a bit with the latest share price settling at $107.82. While the year-to-date share price return is an impressive 24.2%, a recent pullback and a 16.4% one-year total shareholder return point to solid long-term performance even as near-term enthusiasm has faded.
If you're tracking shifts in the auto industry, this is an ideal moment to see how peers are performing. Take a closer look at See the full list for free.
With shares currently trading about 24 percent below consensus price targets and an even greater discount compared to some intrinsic valuations, investors are left wondering if this is a real buying opportunity or if the market is already pricing in Visteon’s future growth.
Most Popular Narrative: 19% Undervalued
Visteon's narrative fair value sits well above its recent price, drawing attention to a projected upside that stands out among peers. This wide gap raises the question: what bold assumptions are fueling the valuation thesis?
Visteon's advancements in automotive display technologies and cockpit AI solutions are likely to drive future revenue growth as they position the company as a top supplier for large displays and digital cockpit innovations. The recent new business wins, totaling $1.9 billion, especially with key OEMs like Toyota and the expansion plans with fast-growing domestic OEMs in China, are expected to bolster future earnings and revenue streams.
Want to know what numbers support this optimism? Here’s a hint: this narrative is banking on future margins and growth targets that diverge from recent trends. Unlock the full breakdown behind the projected trajectory and see which specific earnings moves were included in this eye-catching target.
Result: Fair Value of $133 (UNDERVALUED)
Have a read of the narrative in full and understand what's behind the forecasts.
However, continuing tariff pressures and production declines in key regions could quickly challenge these upbeat forecasts if market conditions worsen unexpectedly.
Find out about the key risks to this Visteon narrative.
Another View: What Do Earnings Ratios Say?
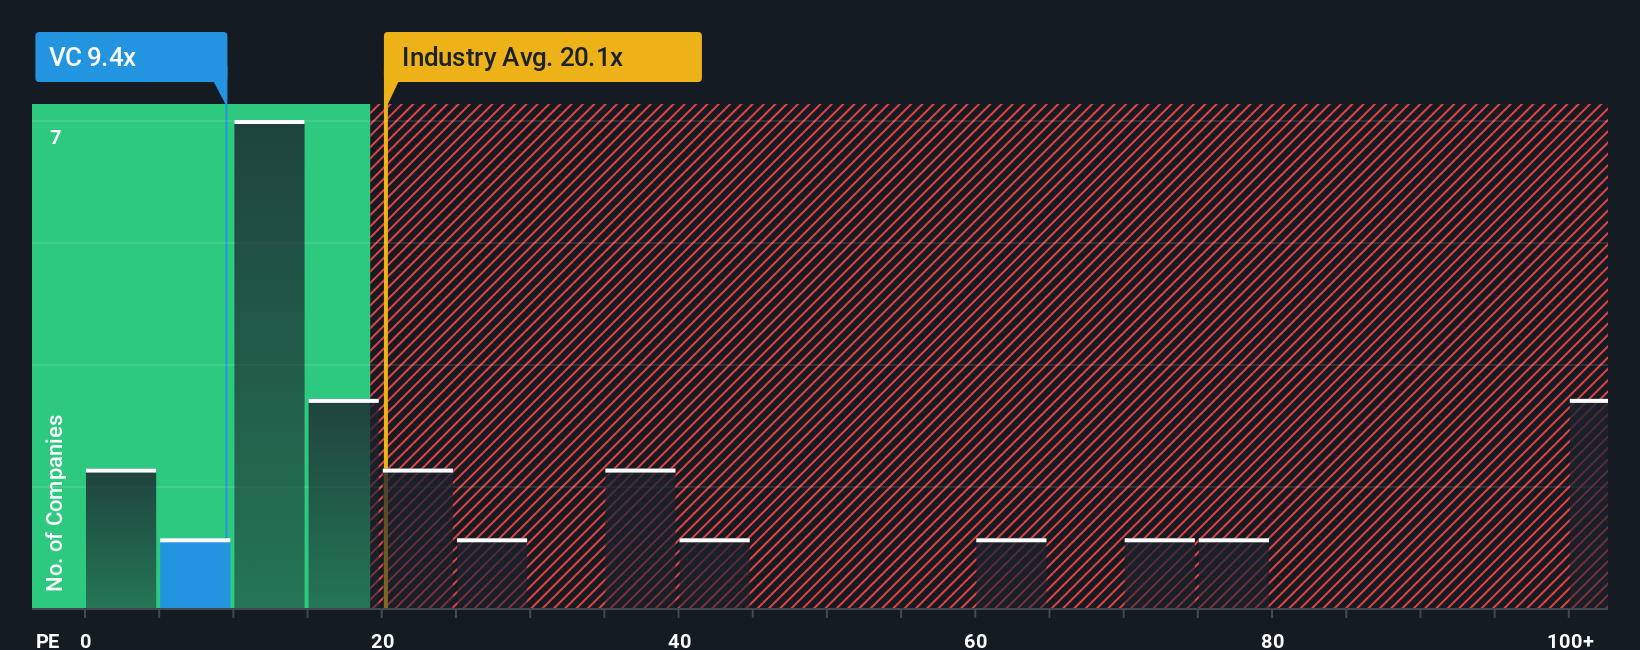
While the narrative and fair value estimate attract attention, our check of Visteon's price-to-earnings ratio reveals a different story. Visteon trades at 9.5x earnings, well below the US Auto Components industry average of 18.5x and the peer group average of 38x, but above its own fair ratio of 7.8x. This gap suggests that although shares appear inexpensive next to peers, there may still be room for valuation to come down toward the calculated fair ratio, or the market could be pricing in higher future risks. Could investor expectations shift and narrow this gap even further?
See what the numbers say about this price — find out in our valuation breakdown.
Build Your Own Visteon Narrative
If you prefer to dig through the details yourself or want a fresh perspective, you can craft your own analysis in under three minutes with Do it your way.
A great starting point for your Visteon research is our analysis highlighting 2 key rewards and 3 important warning signs that could impact your investment decision.
Looking for More Compelling Investment Ideas?
Don’t settle for one potential winner when you can uncover a whole lineup of exciting possibilities. The Simply Wall Street Screener brings new opportunities to your fingertips. Be sure to check it out before the market moves.
- Boost your portfolio’s future potential by checking out these 880 undervalued stocks based on cash flows based on robust cash flow signals you might be overlooking.
- Tap into the rapidly transforming healthcare industry by reviewing these 33 healthcare AI stocks as it aims to change patient care with advanced technology and innovation.
- Enhance your strategy with steady income from these 17 dividend stocks with yields > 3% offering above-average returns for investors who prioritize both growth and stability.
This article by Simply Wall St is general in nature. We provide commentary based on historical data and analyst forecasts only using an unbiased methodology and our articles are not intended to be financial advice. It does not constitute a recommendation to buy or sell any stock, and does not take account of your objectives, or your financial situation. We aim to bring you long-term focused analysis driven by fundamental data. Note that our analysis may not factor in the latest price-sensitive company announcements or qualitative material. Simply Wall St has no position in any stocks mentioned.
Have feedback on this article? Concerned about the content? Get in touch with us directly. Alternatively, email editorial-team@simplywallst.com
Contact Us
Contact Number : +852 3852 8500Service Email : service@webull.hkBusiness Cooperation : marketinghk@webull.hkWebull Securities Limited is licensed with the Securities and Futures Commission of Hong Kong (CE No. BNG700) for carrying out Type 1 License for Dealing in Securities, Type 2 License for Dealing in Futures Contracts and Type 4 License for Advising on Securities.

English