
More Unpleasant Surprises Could Be In Store For Wison Engineering Services Co. Ltd.'s (HKG:2236) Shares After Tumbling 27%
Wison Engineering Services Co. Ltd. (HKG:2236) shareholders won't be pleased to see that the share price has had a very rough month, dropping 27% and undoing the prior period's positive performance. Of course, over the longer-term many would still wish they owned shares as the stock's price has soared 118% in the last twelve months.
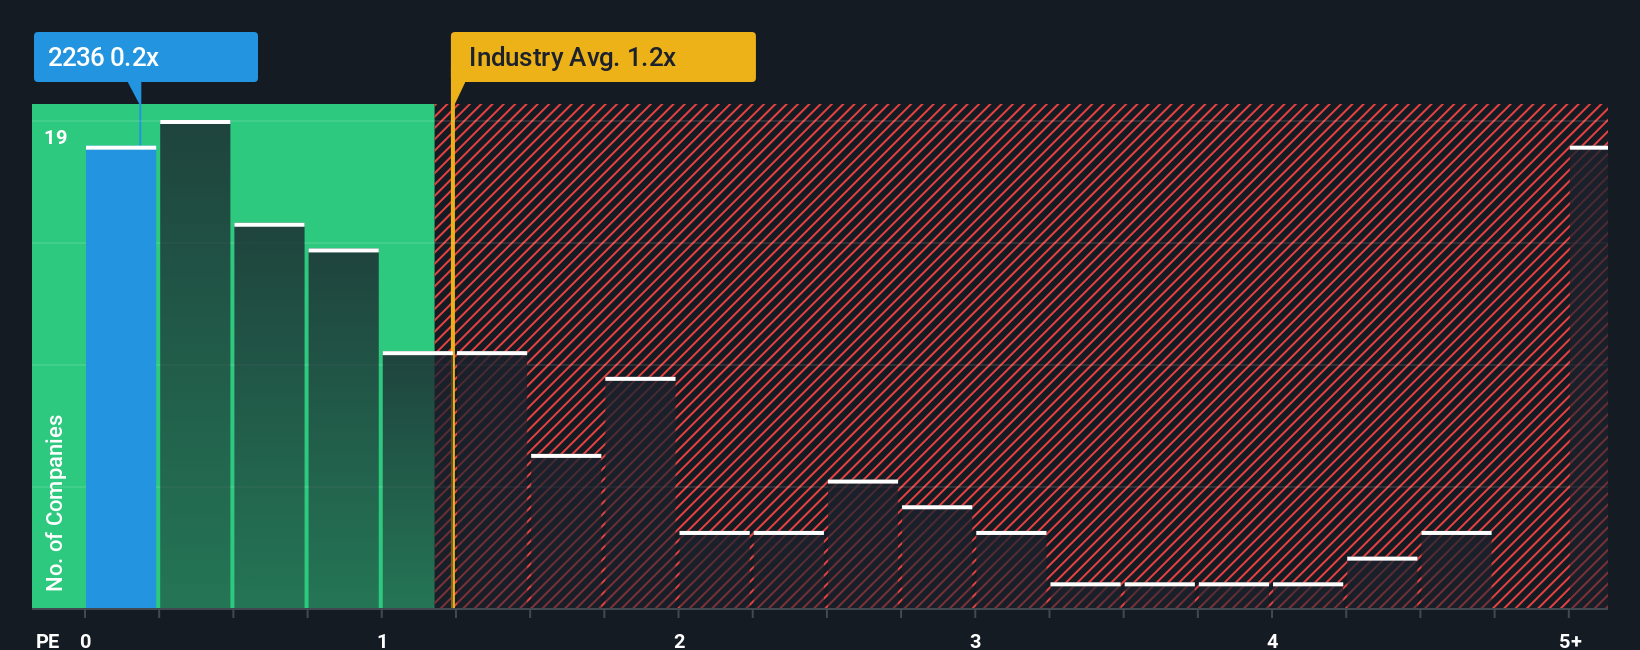
Even after such a large drop in price, it's still not a stretch to say that Wison Engineering Services' price-to-sales (or "P/S") ratio of 0.2x right now seems quite "middle-of-the-road" compared to the Energy Services industry in Hong Kong, where the median P/S ratio is around 0.5x. While this might not raise any eyebrows, if the P/S ratio is not justified investors could be missing out on a potential opportunity or ignoring looming disappointment.
View our latest analysis for Wison Engineering Services
What Does Wison Engineering Services' P/S Mean For Shareholders?
With revenue growth that's exceedingly strong of late, Wison Engineering Services has been doing very well. Perhaps the market is expecting future revenue performance to taper off, which has kept the P/S from rising. Those who are bullish on Wison Engineering Services will be hoping that this isn't the case, so that they can pick up the stock at a lower valuation.
Although there are no analyst estimates available for Wison Engineering Services, take a look at this free data-rich visualisation to see how the company stacks up on earnings, revenue and cash flow.Do Revenue Forecasts Match The P/S Ratio?
Wison Engineering Services' P/S ratio would be typical for a company that's only expected to deliver moderate growth, and importantly, perform in line with the industry.
If we review the last year of revenue growth, the company posted a terrific increase of 97%. The latest three year period has also seen a 26% overall rise in revenue, aided extensively by its short-term performance. So we can start by confirming that the company has actually done a good job of growing revenue over that time.
This is in contrast to the rest of the industry, which is expected to grow by 11% over the next year, materially higher than the company's recent medium-term annualised growth rates.
In light of this, it's curious that Wison Engineering Services' P/S sits in line with the majority of other companies. Apparently many investors in the company are less bearish than recent times would indicate and aren't willing to let go of their stock right now. Maintaining these prices will be difficult to achieve as a continuation of recent revenue trends is likely to weigh down the shares eventually.
The Final Word
With its share price dropping off a cliff, the P/S for Wison Engineering Services looks to be in line with the rest of the Energy Services industry. Using the price-to-sales ratio alone to determine if you should sell your stock isn't sensible, however it can be a practical guide to the company's future prospects.
Our examination of Wison Engineering Services revealed its poor three-year revenue trends aren't resulting in a lower P/S as per our expectations, given they look worse than current industry outlook. Right now we are uncomfortable with the P/S as this revenue performance isn't likely to support a more positive sentiment for long. Unless there is a significant improvement in the company's medium-term performance, it will be difficult to prevent the P/S ratio from declining to a more reasonable level.
A lot of potential risks can sit within a company's balance sheet. Take a look at our free balance sheet analysis for Wison Engineering Services with six simple checks on some of these key factors.
If companies with solid past earnings growth is up your alley, you may wish to see this free collection of other companies with strong earnings growth and low P/E ratios.
Have feedback on this article? Concerned about the content? Get in touch with us directly. Alternatively, email editorial-team (at) simplywallst.com.
This article by Simply Wall St is general in nature. We provide commentary based on historical data and analyst forecasts only using an unbiased methodology and our articles are not intended to be financial advice. It does not constitute a recommendation to buy or sell any stock, and does not take account of your objectives, or your financial situation. We aim to bring you long-term focused analysis driven by fundamental data. Note that our analysis may not factor in the latest price-sensitive company announcements or qualitative material. Simply Wall St has no position in any stocks mentioned.
Contact Us
Contact Number :+852 3852 8500Webull Securities Limited is licensed with the Securities and Futures Commission of Hong Kong (CE No. BNG700) for carrying out Type 1 License for Dealing in Securities, Type 2 License for Dealing in Futures Contracts and Type 4 License for Advising on Securities.

English