
SolarEdge Technologies (SEDG): Evaluating Valuation Following Strategic Grid Support Partnership With Texture
SolarEdge Technologies (SEDG) is teaming up with Texture to strengthen its approach to connecting solar devices with grid support programs. This partnership focuses on making it easier for OEMs and aggregators to participate in California’s Demand Side Grid Support program.
See our latest analysis for SolarEdge Technologies.
SolarEdge Technologies’ latest partnership comes after an impressive recent run, with a 155.68% year-to-date share price return and a 90-day rally of 46.61%. While longer-term total shareholder returns remain deeply negative, recent momentum suggests growing optimism. Strategic moves like this could help turn the tide or at least signal a shift in market sentiment.
If news of SolarEdge's strategic push got you thinking, it might be worth broadening your search and discovering See the full list for free..
But does this recent surge mean SolarEdge is trading below its true value, or has the latest round of positive news already been fully priced into the stock? Could there still be a buying opportunity, or is the market now anticipating future growth?
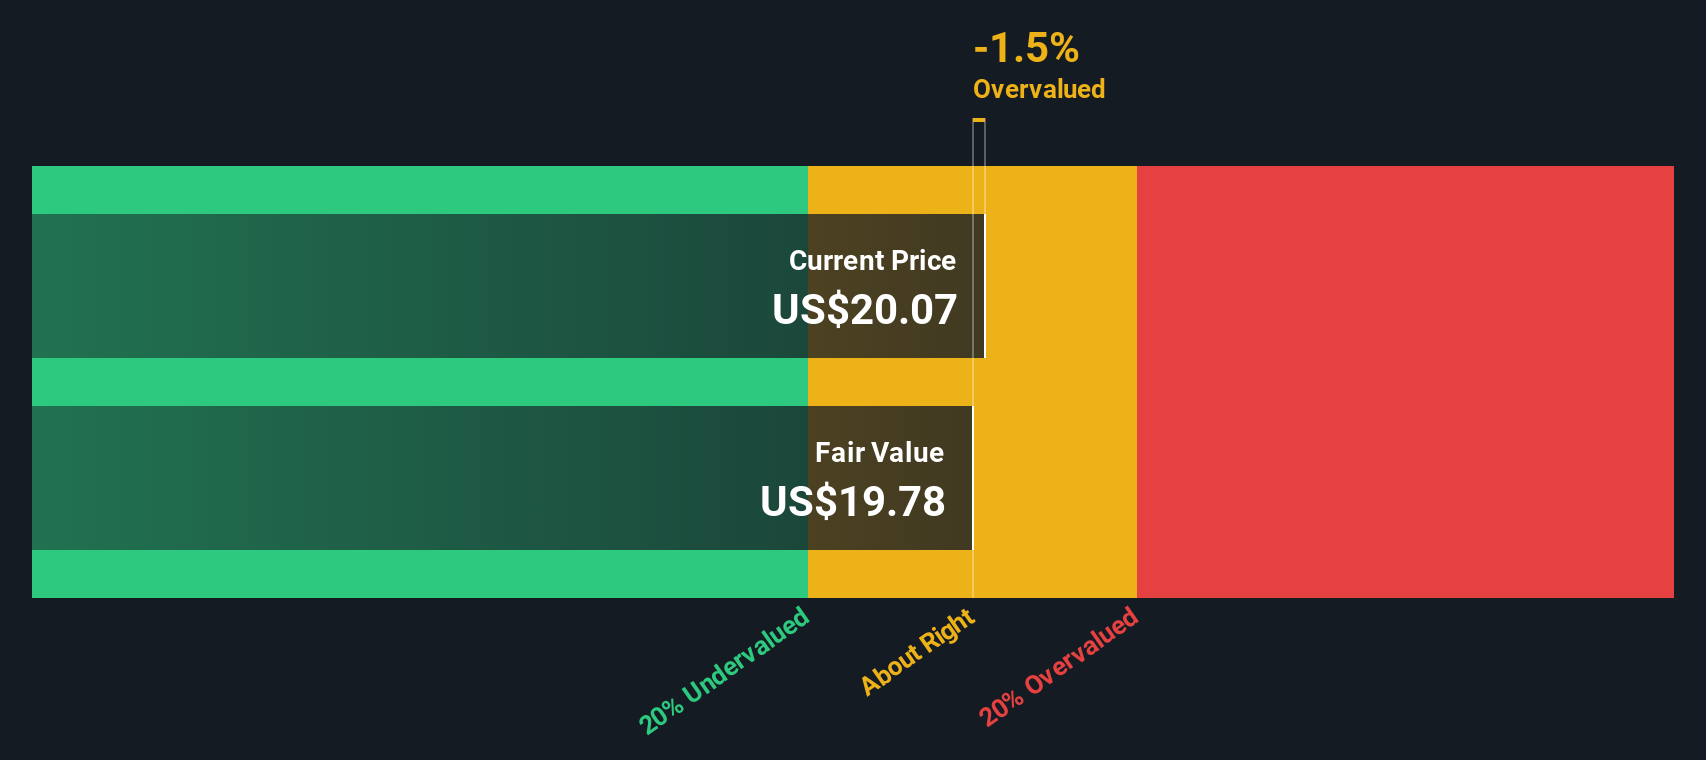
Most Popular Narrative: 38.8% Overvalued
SolarEdge Technologies' most closely followed narrative sets its fair value substantially below the last close price, underscoring significant premium expectations from the market. This contrast invites closer inspection of the optimistic assumptions underpinning current pricing.
The rally in SolarEdge's stock appears to be pricing in robust future revenue growth driven by U.S. policy support (extension of manufacturing and storage credits), but risks are rising as the elimination of the 25D residential solar tax credit is expected to cause a substantial drop in U.S. residential demand in 2026, only partially offset by shifts toward third-party owned (TPO) systems. This could potentially constrain topline growth.
Just how bullish are the expectations behind this price? The narrative banks on a dramatic pivot in revenue, margin expansion, and return to profitability. Ever wondered which specific financial levers have to deliver for this story to play out? Dig in to uncover what is driving this heady valuation call and how far reality might have to stretch.
Result: Fair Value of $27.27 (OVERVALUED)
Have a read of the narrative in full and understand what's behind the forecasts.
However, continued US policy incentives and stabilization in key distribution channels could serve as catalysts for earnings recovery. This could potentially invalidate the current overvalued narrative.
Find out about the key risks to this SolarEdge Technologies narrative.
Another View: SWS DCF Model Suggests Undervaluation
Looking at things differently, our DCF model points to a fair value of $70.11 for SolarEdge Technologies, which is well above its recent market price. This stands in sharp contrast to the overvaluation indicated by price-based multiples and raises questions about which narrative will play out for investors.
Look into how the SWS DCF model arrives at its fair value.
Build Your Own SolarEdge Technologies Narrative
If you see the story differently or want to dig into the numbers on your own terms, you can craft your own narrative in just a few minutes. Do it your way.
A great starting point for your SolarEdge Technologies research is our analysis highlighting 2 key rewards and 1 important warning sign that could impact your investment decision.
Looking for more investment ideas?
Act now to expand your horizon beyond SolarEdge Technologies. Uncover unique opportunities and handpicked stocks tailored to different strategies using the powerful Simply Wall Street Screener.
- Tap into market potential by uncovering these 3575 penny stocks with strong financials, which combine strong financials with high growth prospects and aren't on most investors' radar yet.
- Pursue innovation in healthcare by checking out these 34 healthcare AI stocks, where artificial intelligence is transforming patient care, diagnostics, and medical technology leadership.
- Boost your income stream by tracking down these 21 dividend stocks with yields > 3%, featuring reliable companies offering yields greater than 3% for a foundation of steady returns.
This article by Simply Wall St is general in nature. We provide commentary based on historical data and analyst forecasts only using an unbiased methodology and our articles are not intended to be financial advice. It does not constitute a recommendation to buy or sell any stock, and does not take account of your objectives, or your financial situation. We aim to bring you long-term focused analysis driven by fundamental data. Note that our analysis may not factor in the latest price-sensitive company announcements or qualitative material. Simply Wall St has no position in any stocks mentioned.
Have feedback on this article? Concerned about the content? Get in touch with us directly. Alternatively, email editorial-team@simplywallst.com
Contact Us
Contact Number : +852 3852 8500Service Email : service@webull.hkBusiness Cooperation : marketinghk@webull.hkWebull Securities Limited is licensed with the Securities and Futures Commission of Hong Kong (CE No. BNG700) for carrying out Type 1 License for Dealing in Securities, Type 2 License for Dealing in Futures Contracts and Type 4 License for Advising on Securities.

English