
Does the Family Dollar Sale Signal a New Era for Dollar Tree Stock in 2025?
- Ever wondered if Dollar Tree is truly a bargain at today’s price? Let’s dig into whether the recent buzz matches up with real value or just hype.
- The stock has surged an impressive 32.5% year-to-date and jumped 60.1% over the last year, which may suggest that something significant is underway.
- Much of the excitement comes after Dollar Tree announced the sale of its Family Dollar stores and initiated new cost-cutting strategies. These moves have sparked broad conversations among investors about the company's turnaround potential and how it could influence future growth.
- Right now, Dollar Tree’s valuation score sits at 3 out of 6 checks for being undervalued. This is a solid showing, but is that the whole story? Before we dive into the usual valuation yardsticks, stay tuned to see if there is an even smarter way to judge the company’s true worth.
Approach 1: Dollar Tree Discounted Cash Flow (DCF) Analysis
A Discounted Cash Flow (DCF) model estimates the intrinsic value of a company by projecting its future cash flows and then discounting them back to today’s dollars. For Dollar Tree, the model uses what is called a "2 Stage Free Cash Flow to Equity" approach to forecast how much cash the company will generate and ultimately return to shareholders.
Currently, Dollar Tree’s Free Cash Flow stands at $1.89 Billion. Analyst forecasts provide explicit cash flow estimates for the next five years, after which Simply Wall St extrapolates longer-term trend projections. By 2029, projected Free Cash Flow is expected to fall to $914 Million, indicating a decreasing growth trajectory over time.
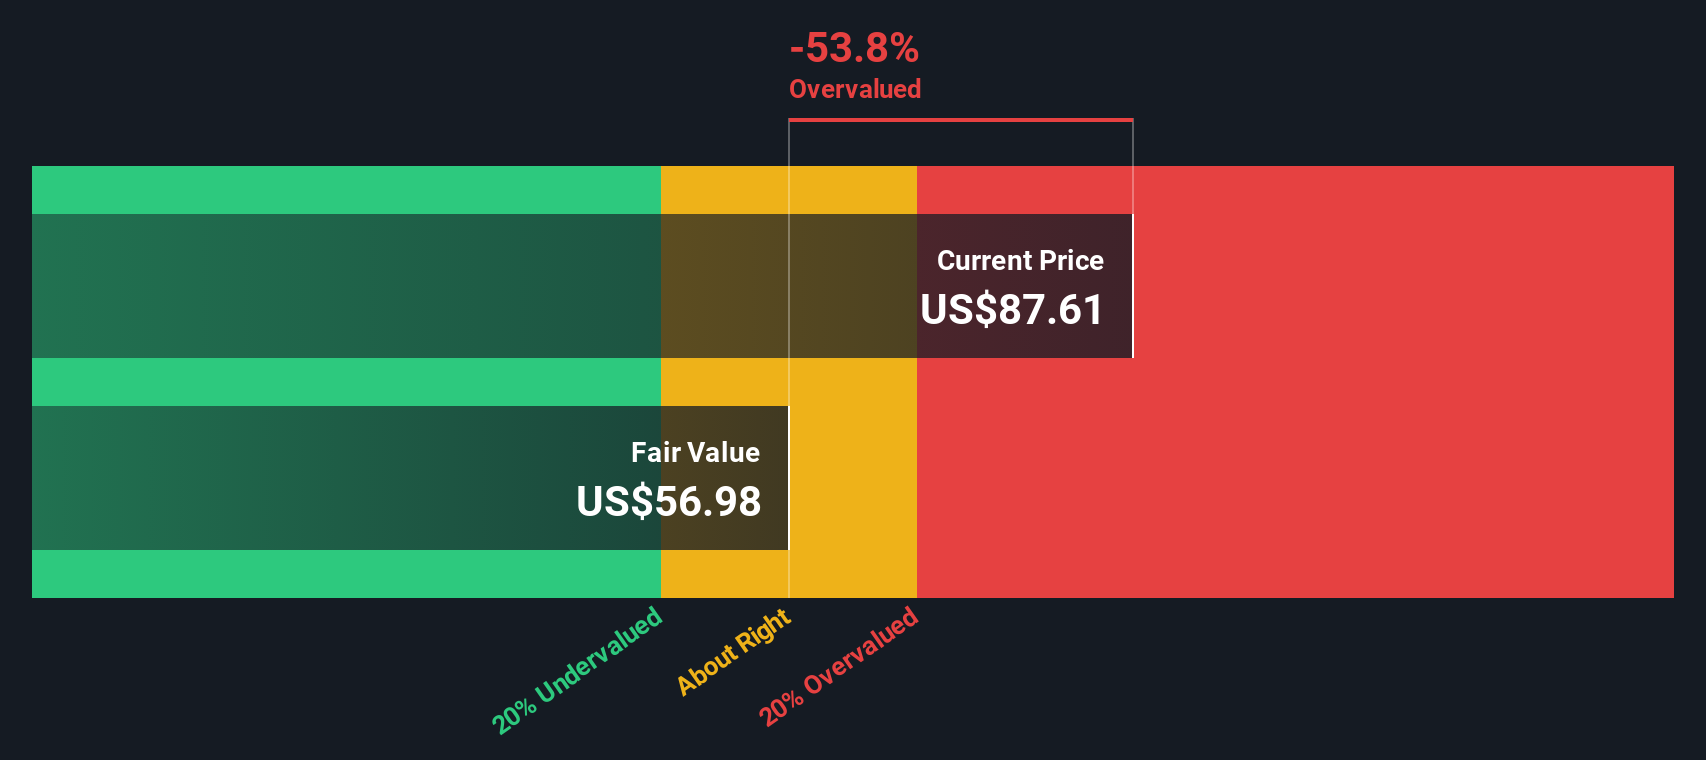
After adding up all those discounted future cash flows, the DCF model calculates an intrinsic fair value of $57.53 per share for Dollar Tree. Compared to the company’s current market price, this suggests that the stock is about 76.1% above its DCF-based estimate, signaling significant overvaluation on these cash flow assumptions.
Result: OVERVALUED
Our Discounted Cash Flow (DCF) analysis suggests Dollar Tree may be overvalued by 76.1%. Discover 853 undervalued stocks or create your own screener to find better value opportunities.
Approach 2: Dollar Tree Price vs Earnings
The Price-to-Earnings (PE) ratio is a classic valuation metric for profitable companies like Dollar Tree. By comparing a company's share price to its earnings per share, investors can quickly gauge how much the market is willing to pay for each dollar of profit. This method is especially relevant for companies with steady profitability, as it directly reflects earnings power.
However, what counts as a “normal” or “fair” PE ratio varies depending on expected earnings growth and perceived business risks. Rapidly growing companies or those in defensive industries typically command higher PE multiples, while businesses facing uncertainty or stagnation often have lower ones.
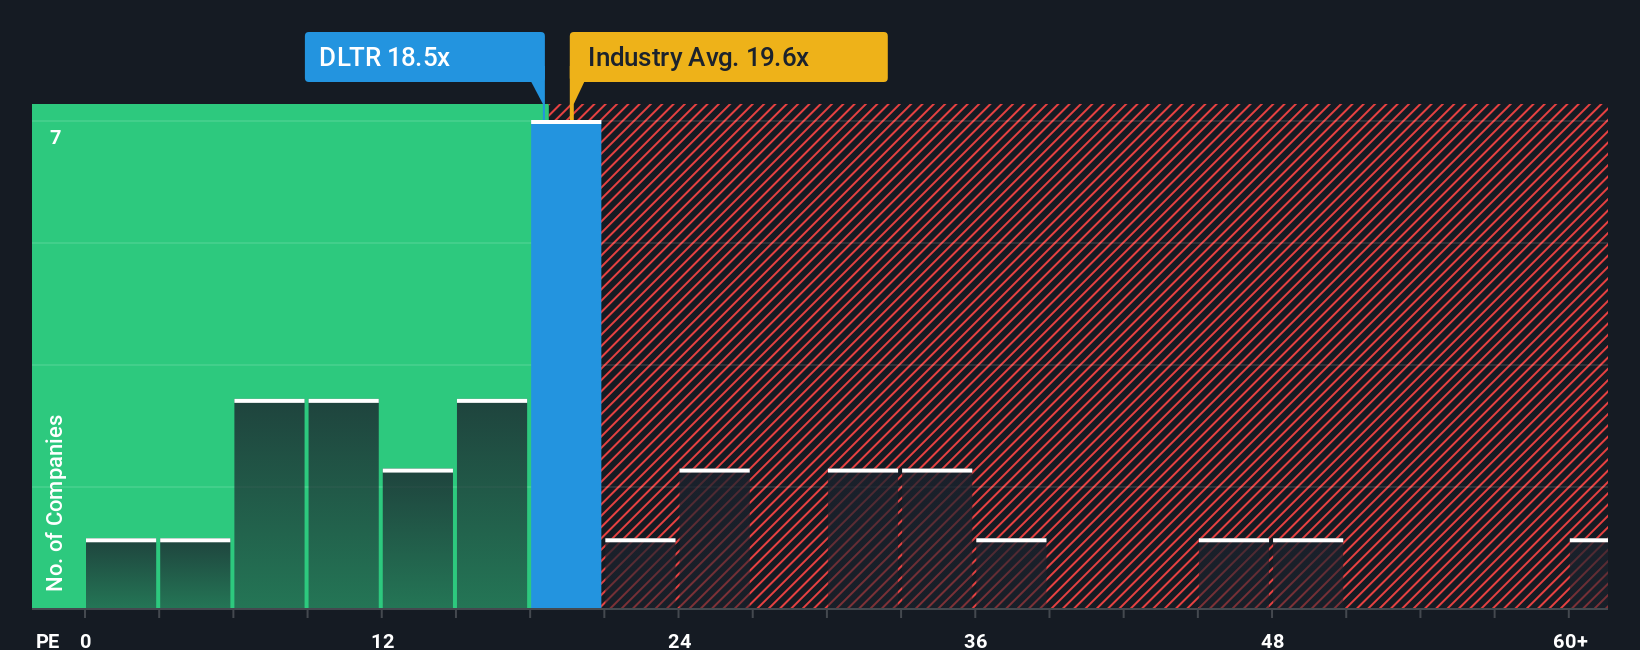
Currently, Dollar Tree trades at a PE of 18.6x. This is right in line with the peer group average of 18.8x and sits just below the Consumer Retailing industry average of 20.8x. While these benchmarks provide context, they do not always account for company-specific strengths and risks.
That is where Simply Wall St’s proprietary “Fair Ratio” comes in. This is a bespoke figure (here, 21.3x) that blends analysis of Dollar Tree’s earnings growth prospects, industry, profit margins, size, and risk factors. This tailored approach delivers a sharper, more company-specific view than pure peer or industry comparisons.
Stacking Dollar Tree’s actual PE of 18.6x against its Fair Ratio of 21.3x, the stock looks modestly undervalued, trading below what would be expected once all the key factors are considered together.
Result: UNDERVALUED
PE ratios tell one story, but what if the real opportunity lies elsewhere? Discover 1394 companies where insiders are betting big on explosive growth.
Upgrade Your Decision Making: Choose your Dollar Tree Narrative
Earlier, we mentioned that there is an even better way to understand valuation, so let's introduce you to Narratives. A Narrative is more than just a number; it is your personal perspective on a company, weaving together your story about its future with your estimates for things like fair value, revenue, earnings, and margins. Narratives connect the company's real-world outlook to a dynamic financial forecast, building a bridge from ideas to actionable fair value estimates.
On Simply Wall St, Narratives are easy and intuitive, empowering millions of investors within the Community page to see and share their thesis all in one place. Investors use Narratives to decide when to buy or sell by directly comparing their own Fair Value to the current market Price, offering an intuitive way to act on changing information. Best of all, Narratives update automatically, so whenever news breaks or new earnings are reported, your view adapts right away.
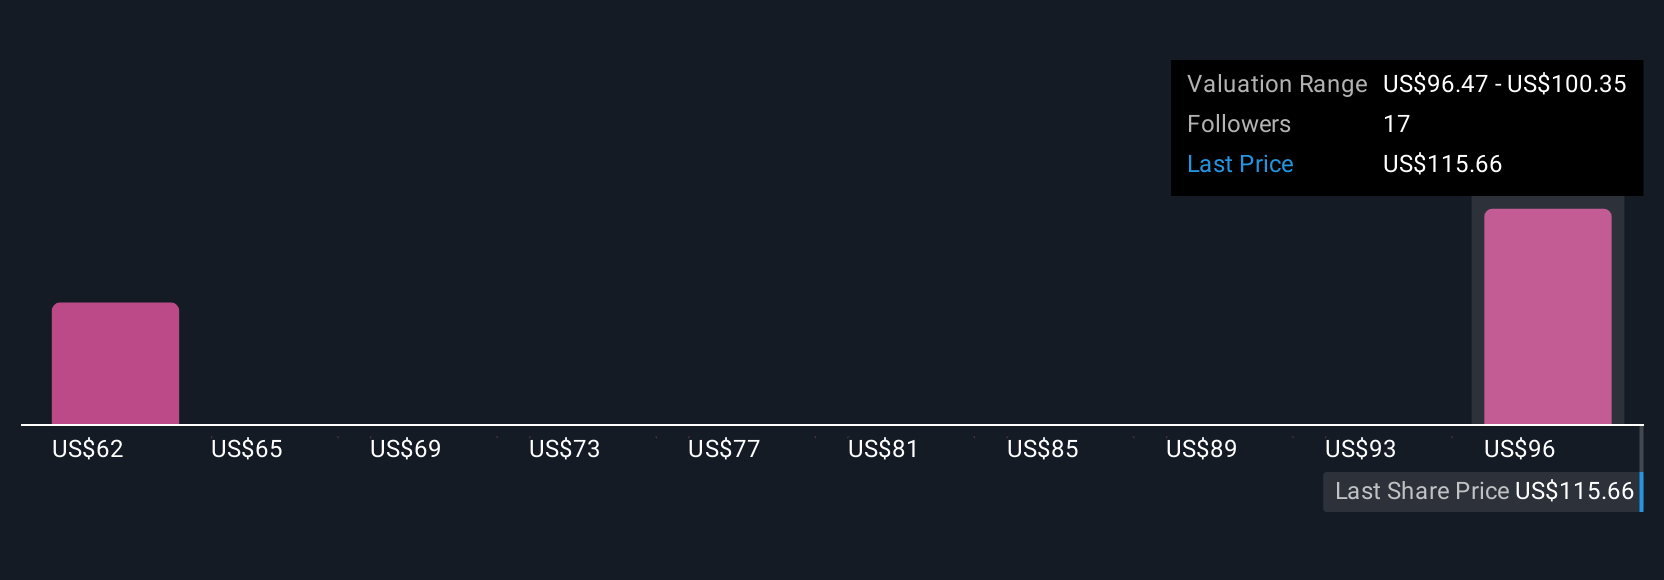
For Dollar Tree, Narratives help explain why some investors, based on bullish expectations for revenue growth and margin improvement, estimate a Fair Value as high as $140 per share, while others with more cautious earnings outlooks see it as low as $75. This flexibility lets you anchor your investment decisions to your own beliefs, driven by both the story and the numbers.
Do you think there's more to the story for Dollar Tree? Head over to our Community to see what others are saying!
This article by Simply Wall St is general in nature. We provide commentary based on historical data and analyst forecasts only using an unbiased methodology and our articles are not intended to be financial advice. It does not constitute a recommendation to buy or sell any stock, and does not take account of your objectives, or your financial situation. We aim to bring you long-term focused analysis driven by fundamental data. Note that our analysis may not factor in the latest price-sensitive company announcements or qualitative material. Simply Wall St has no position in any stocks mentioned.
Have feedback on this article? Concerned about the content? Get in touch with us directly. Alternatively, email editorial-team@simplywallst.com
Contact Us
Contact Number : +852 3852 8500Service Email : service@webull.hkBusiness Cooperation : marketinghk@webull.hkWebull Securities Limited is licensed with the Securities and Futures Commission of Hong Kong (CE No. BNG700) for carrying out Type 1 License for Dealing in Securities, Type 2 License for Dealing in Futures Contracts and Type 4 License for Advising on Securities.

English