
EPS Creative Health Technology Group Limited's (HKG:3860) Shares Climb 52% But Its Business Is Yet to Catch Up
EPS Creative Health Technology Group Limited (HKG:3860) shareholders have had their patience rewarded with a 52% share price jump in the last month. Looking back a bit further, it's encouraging to see the stock is up 36% in the last year.
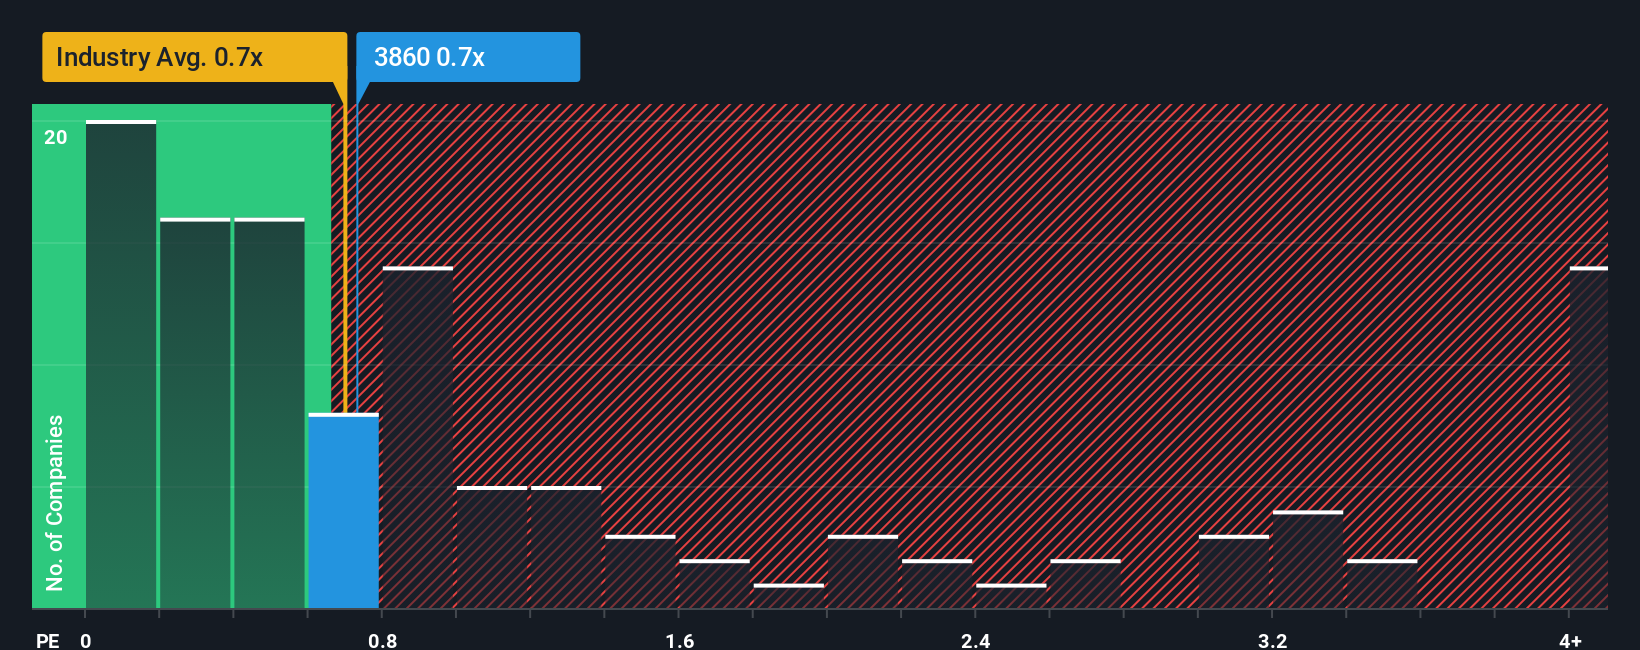
Even after such a large jump in price, you could still be forgiven for feeling indifferent about EPS Creative Health Technology Group's P/S ratio of 0.7x, since the median price-to-sales (or "P/S") ratio for the Luxury industry in Hong Kong is about the same. While this might not raise any eyebrows, if the P/S ratio is not justified investors could be missing out on a potential opportunity or ignoring looming disappointment.
Check out our latest analysis for EPS Creative Health Technology Group
How Has EPS Creative Health Technology Group Performed Recently?
For example, consider that EPS Creative Health Technology Group's financial performance has been poor lately as its revenue has been in decline. Perhaps investors believe the recent revenue performance is enough to keep in line with the industry, which is keeping the P/S from dropping off. If you like the company, you'd at least be hoping this is the case so that you could potentially pick up some stock while it's not quite in favour.
Want the full picture on earnings, revenue and cash flow for the company? Then our free report on EPS Creative Health Technology Group will help you shine a light on its historical performance.Is There Some Revenue Growth Forecasted For EPS Creative Health Technology Group?
In order to justify its P/S ratio, EPS Creative Health Technology Group would need to produce growth that's similar to the industry.
Retrospectively, the last year delivered a frustrating 16% decrease to the company's top line. At least revenue has managed not to go completely backwards from three years ago in aggregate, thanks to the earlier period of growth. Accordingly, shareholders probably wouldn't have been overly satisfied with the unstable medium-term growth rates.
Comparing that to the industry, which is predicted to deliver 18% growth in the next 12 months, the company's momentum is weaker, based on recent medium-term annualised revenue results.
With this in mind, we find it intriguing that EPS Creative Health Technology Group's P/S is comparable to that of its industry peers. It seems most investors are ignoring the fairly limited recent growth rates and are willing to pay up for exposure to the stock. They may be setting themselves up for future disappointment if the P/S falls to levels more in line with recent growth rates.
What Does EPS Creative Health Technology Group's P/S Mean For Investors?
Its shares have lifted substantially and now EPS Creative Health Technology Group's P/S is back within range of the industry median. It's argued the price-to-sales ratio is an inferior measure of value within certain industries, but it can be a powerful business sentiment indicator.
We've established that EPS Creative Health Technology Group's average P/S is a bit surprising since its recent three-year growth is lower than the wider industry forecast. Right now we are uncomfortable with the P/S as this revenue performance isn't likely to support a more positive sentiment for long. If recent medium-term revenue trends continue, the probability of a share price decline will become quite substantial, placing shareholders at risk.
Before you take the next step, you should know about the 4 warning signs for EPS Creative Health Technology Group (2 can't be ignored!) that we have uncovered.
Of course, profitable companies with a history of great earnings growth are generally safer bets. So you may wish to see this free collection of other companies that have reasonable P/E ratios and have grown earnings strongly.
Have feedback on this article? Concerned about the content? Get in touch with us directly. Alternatively, email editorial-team (at) simplywallst.com.
This article by Simply Wall St is general in nature. We provide commentary based on historical data and analyst forecasts only using an unbiased methodology and our articles are not intended to be financial advice. It does not constitute a recommendation to buy or sell any stock, and does not take account of your objectives, or your financial situation. We aim to bring you long-term focused analysis driven by fundamental data. Note that our analysis may not factor in the latest price-sensitive company announcements or qualitative material. Simply Wall St has no position in any stocks mentioned.
Contact Us
Contact Number : +852 3852 8500Service Email : service@webull.hkBusiness Cooperation : marketinghk@webull.hkWebull Securities Limited is licensed with the Securities and Futures Commission of Hong Kong (CE No. BNG700) for carrying out Type 1 License for Dealing in Securities, Type 2 License for Dealing in Futures Contracts and Type 4 License for Advising on Securities.

English