
Does the Recent 15% Drop Signal Opportunity in Dorman Products for 2025?
- Wondering if Dorman Products is trading at a bargain or if it's already fully valued? You are not alone, as many investors are eyeing this stock with curiosity in today's market.
- Over the last week, shares dipped by 15.2%, compounding a 13.6% slide over the past month. However, the year-to-date return still holds at a positive 4.4% and 4.9% for the past year, suggesting both volatility and ongoing investor interest.
- Recent headlines have focused on competitive developments in the auto parts industry and fresh product launches from Dorman. This has fueled speculation about the company's ability to maintain its edge. Analysts and industry watchers have also noted changes in distribution partnerships that could affect revenue streams moving forward.
- Dorman Products currently boasts a 5 out of 6 valuation score, meaning it is considered undervalued on most key measures. In the next sections, we will dig into how different valuation approaches assess Dorman's price, and later on, you will discover an unconventional but insightful method to spot true value.
Find out why Dorman Products's 4.9% return over the last year is lagging behind its peers.
Approach 1: Dorman Products Discounted Cash Flow (DCF) Analysis
The Discounted Cash Flow (DCF) model estimates what a business is truly worth by projecting its future cash flows and discounting them back to today’s dollars. For Dorman Products, this model starts with the company’s current Free Cash Flow of $98.5 million and incorporates analyst forecasts, projecting rising cash flows over the next several years.
Looking forward, analysts expect Dorman’s Free Cash Flow to reach $205.95 million by 2026 and $286 million by 2029. Beyond that, additional years are extrapolated, ultimately reaching $395.4 million in 2035. All projections are based on thoughtful estimates and adjusted for future uncertainty.
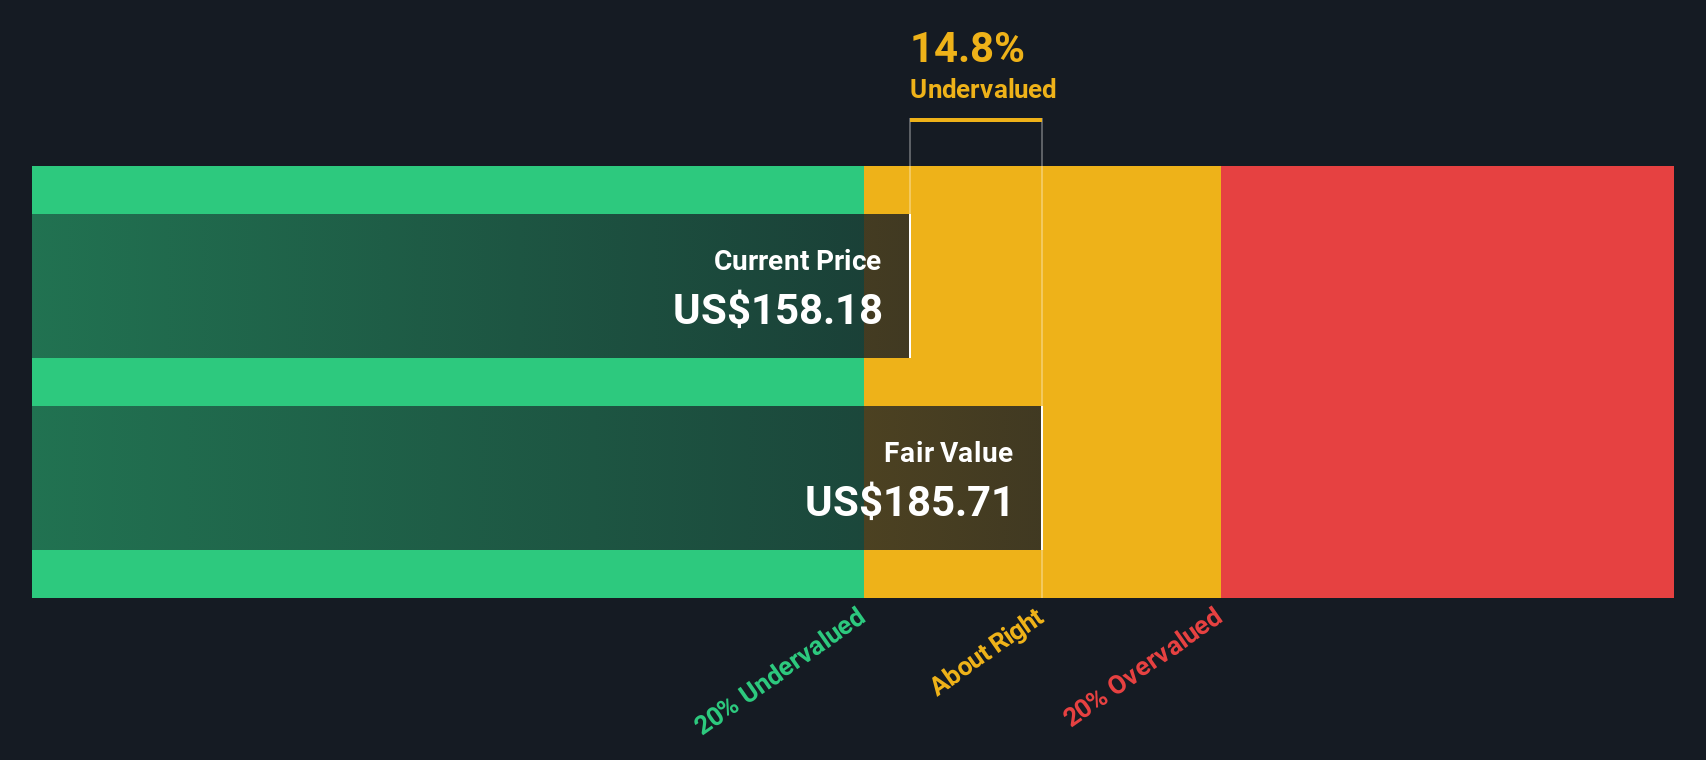
By summing these discounted future cash flows, the DCF model arrives at an intrinsic value of $186.03 per share for Dorman Products. Given the current market price, this result implies the stock is trading at a 27.9% discount, suggesting it is undervalued according to cash flow projections.
Result: UNDERVALUED
Our Discounted Cash Flow (DCF) analysis suggests Dorman Products is undervalued by 27.9%. Track this in your watchlist or portfolio, or discover 834 more undervalued stocks based on cash flows.
Approach 2: Dorman Products Price vs Earnings
The Price-to-Earnings (PE) ratio is a widely used valuation tool for profitable companies like Dorman Products, as it relates the price investors are willing to pay for each dollar of actual earnings. Since Dorman is solidly profitable, the PE ratio provides a direct lens into how the market values its bottom line.
Typically, a "fair" PE ratio reflects expectations for the company's growth as well as broader risk factors. Higher expected growth or lower risk usually merits a higher PE, while slower growth or increased risks justify a lower one. This benchmark helps investors judge whether a stock is commanding an appropriate premium or trading at a discount.
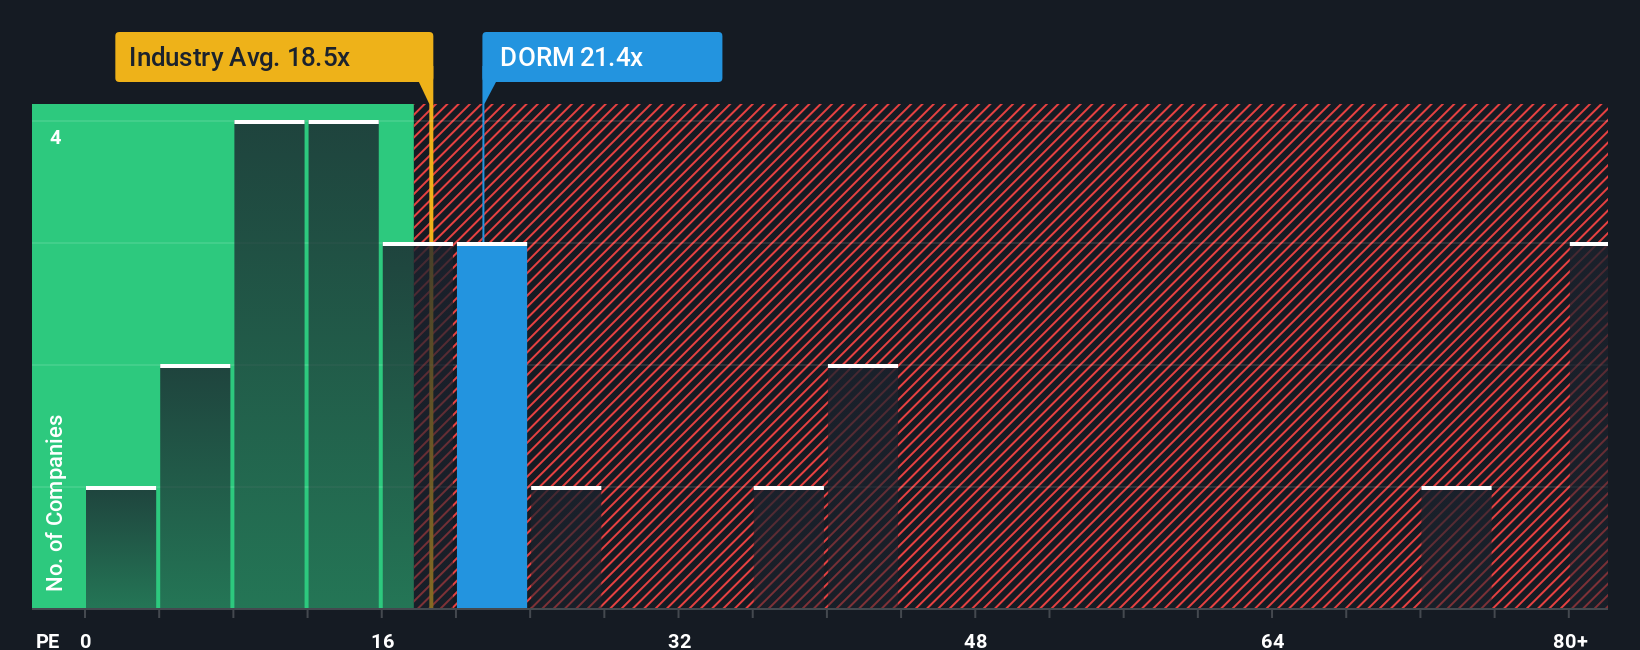
Dorman Products currently trades at a PE ratio of 16.56x. By comparison, the average PE for the Auto Components industry sits at 18.13x, while a peer group averages 19.76x. Simply Wall St’s proprietary "Fair Ratio" for Dorman is calculated at 11.85x, which accounts for factors like company-specific earnings growth, risk profile, margins, industry type and overall market cap.
The Fair Ratio offers a more nuanced benchmark than standard industry or peer comparisons because it incorporates unique performance, growth potential, and risk characteristics into its assessment. This allows for a tailored valuation rather than a broad, one-size-fits-all approach, giving a clearer picture of the stock’s true value.
Since Dorman’s current PE (16.56x) is meaningfully above its Fair Ratio (11.85x), the stock appears to be overvalued by this measure.
Result: OVERVALUED
PE ratios tell one story, but what if the real opportunity lies elsewhere? Discover 1409 companies where insiders are betting big on explosive growth.
Upgrade Your Decision Making: Choose your Dorman Products Narrative
Earlier we mentioned that there is an even better way to understand valuation, so let's introduce you to Narratives.
A Narrative is a simple but powerful tool that lets you connect the story you believe about a company, such as your outlook on its industry drivers, risks, and future prospects, to a set of financial estimates and a resulting fair value.
On Simply Wall St’s Community page, millions of investors use Narratives to make sense of stocks like Dorman Products, because they bring together what matters: your personal view on revenue, earnings, and margins, all linked to a transparent price estimate.
With Narratives, every investor can translate their perspective into numbers, quickly compare their fair value to today's share price, and decide if it's time to buy or sell, all in a few clicks.
Even better, Narratives are updated automatically when new earnings results or important news is released, so your viewpoint can evolve with fresh information.
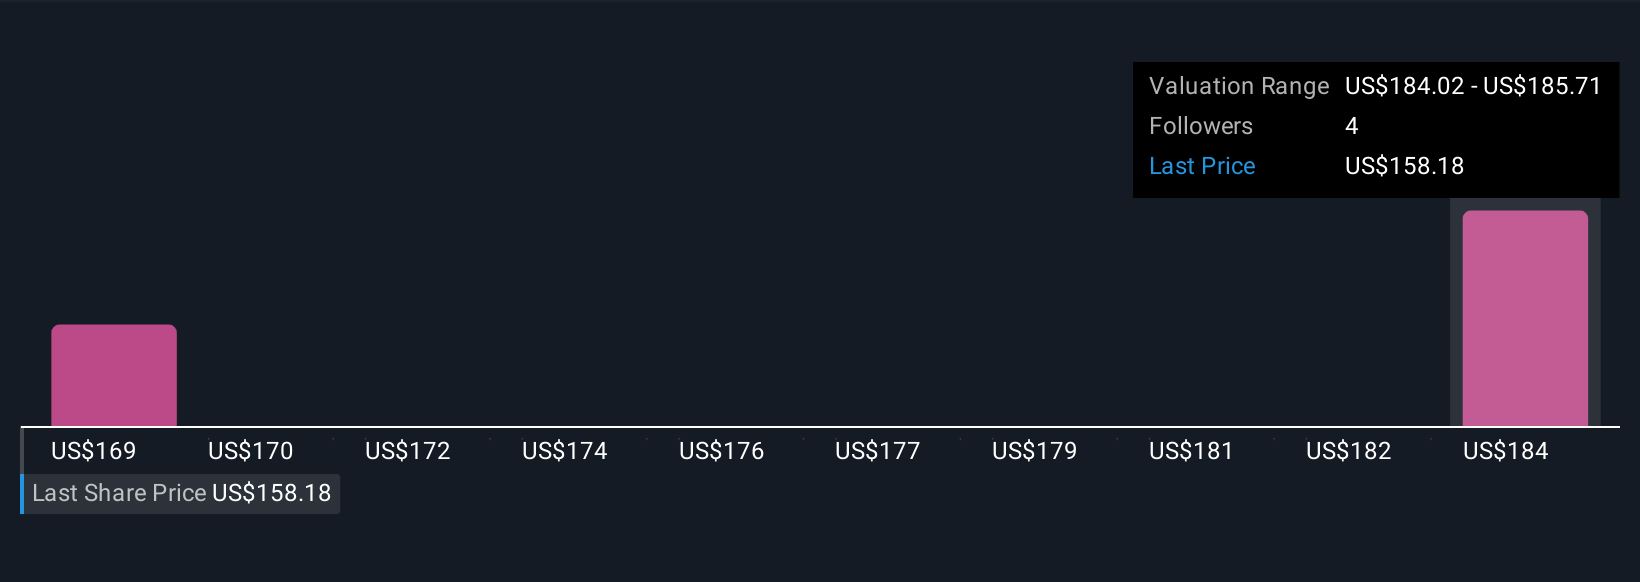
For example, one Dorman Products Narrative might project strong margins and revenue growth from the aging vehicle fleet, supporting a $182 price target, while another sees risks from EV adoption and industry headwinds, resulting in a more cautious $135 valuation based on the same company but different outlooks.
This means Narratives empower you to make investment decisions that are both data-driven and true to your view of the company's future.
Do you think there's more to the story for Dorman Products? Head over to our Community to see what others are saying!
This article by Simply Wall St is general in nature. We provide commentary based on historical data and analyst forecasts only using an unbiased methodology and our articles are not intended to be financial advice. It does not constitute a recommendation to buy or sell any stock, and does not take account of your objectives, or your financial situation. We aim to bring you long-term focused analysis driven by fundamental data. Note that our analysis may not factor in the latest price-sensitive company announcements or qualitative material. Simply Wall St has no position in any stocks mentioned.
Have feedback on this article? Concerned about the content? Get in touch with us directly. Alternatively, email editorial-team@simplywallst.com
Contact Us
Contact Number : +852 3852 8500Service Email : service@webull.hkBusiness Cooperation : marketinghk@webull.hkWebull Securities Limited is licensed with the Securities and Futures Commission of Hong Kong (CE No. BNG700) for carrying out Type 1 License for Dealing in Securities, Type 2 License for Dealing in Futures Contracts and Type 4 License for Advising on Securities.

English