
Is Micron Still a Bargain After a 149.7% Rally in 2025?
- Ever look at Micron Technology and wonder, is this stock actually a hidden bargain or just riding the wave of semiconductor hype?
- Recently, shares have powered higher, boasting a 16.1% jump over the last month and an impressive 149.7% gain year-to-date, though the past week saw a minor dip of -1.7%.
- Driving these swings is the widespread buzz around AI-related chip demand, along with a string of analyst price target increases and Micron’s inclusion in several “best semiconductor stock” lists this year. These factors have kept investor attention focused firmly on Micron.
- For those keeping score, Micron clocks in with a 3 out of 6 on our valuation checklist. This sets up a closer look at how the stock stands on valuation and hints at an even smarter way to assess its potential later in this article.
Approach 1: Micron Technology Discounted Cash Flow (DCF) Analysis
A Discounted Cash Flow (DCF) model attempts to estimate a company's intrinsic value by projecting its future cash flows and then discounting them back to today’s value. By doing this, investors can get a sense of what a business may truly be worth, based on its ability to generate cash over time.
For Micron Technology, the DCF model uses their reported Free Cash Flow of $2.22 Billion as a starting point. Over the next five years, analysts forecast strong growth, with Free Cash Flow expected to reach $10.60 Billion by 2030. After five years, Simply Wall St extrapolates additional years to paint the long-term picture, since detailed analyst estimates usually stop after year five. All figures are presented in US dollars ($).
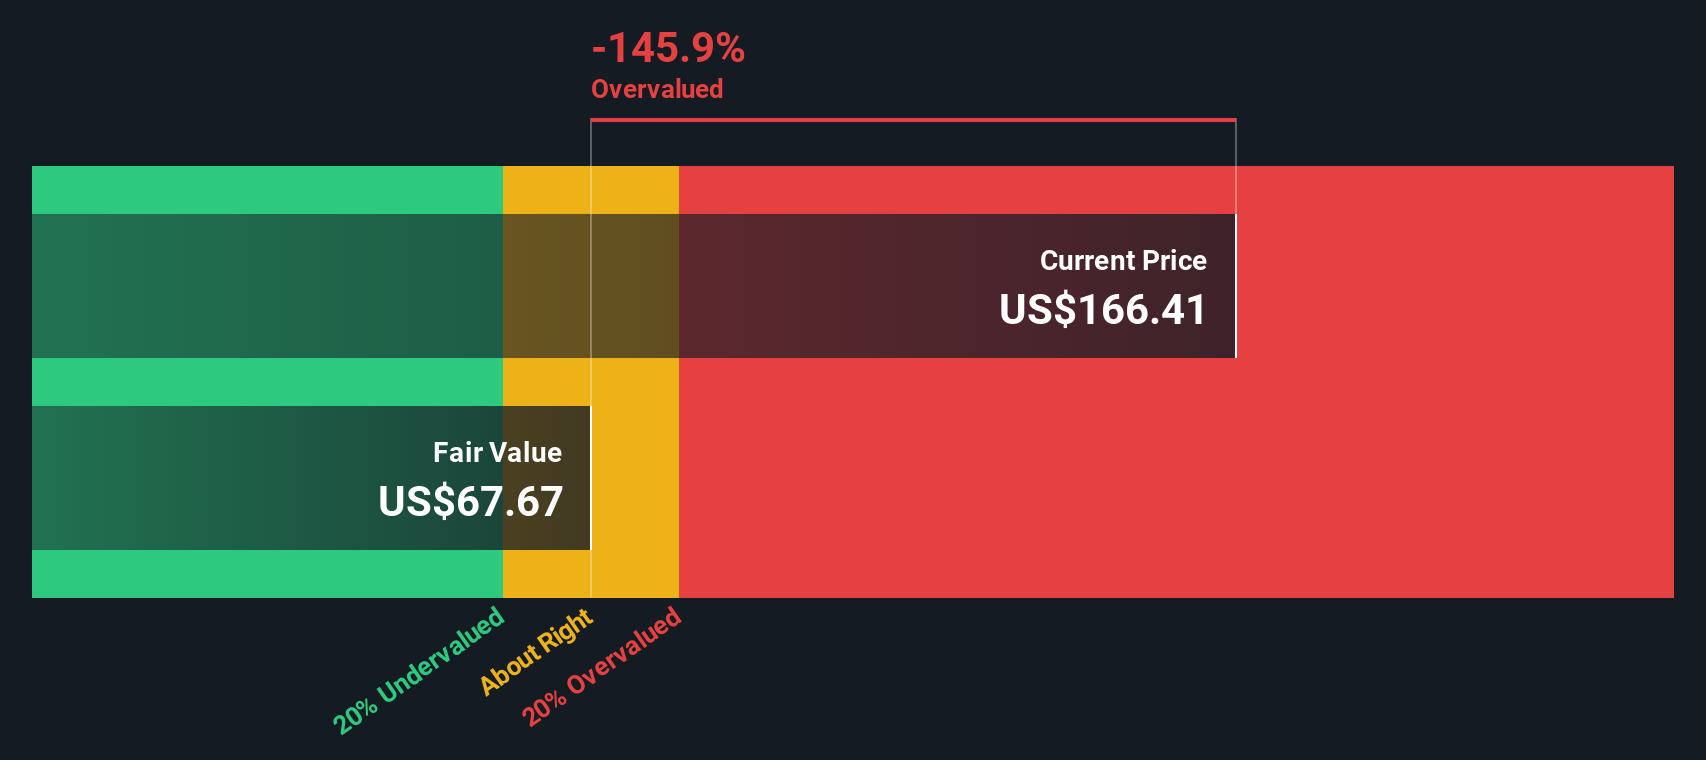
Based on these forecasts and the application of a 2 Stage Free Cash Flow to Equity model, the estimated intrinsic value is $103.85 per share. However, with the current share price running much higher, the DCF suggests the stock is now about 109.9% overvalued. This means the current enthusiasm in the market has pushed Micron’s price well beyond what these cash flow fundamentals would justify.
Result: OVERVALUED
Our Discounted Cash Flow (DCF) analysis suggests Micron Technology may be overvalued by 109.9%. Discover 840 undervalued stocks or create your own screener to find better value opportunities.
Approach 2: Micron Technology Price vs Earnings
The Price-to-Earnings (PE) ratio is a widely-used valuation tool for profitable companies like Micron Technology because it directly measures what investors are willing to pay for each dollar of earnings. For mature or consistently profitable businesses, the PE ratio helps put their valuation into perspective compared to other opportunities in the market.
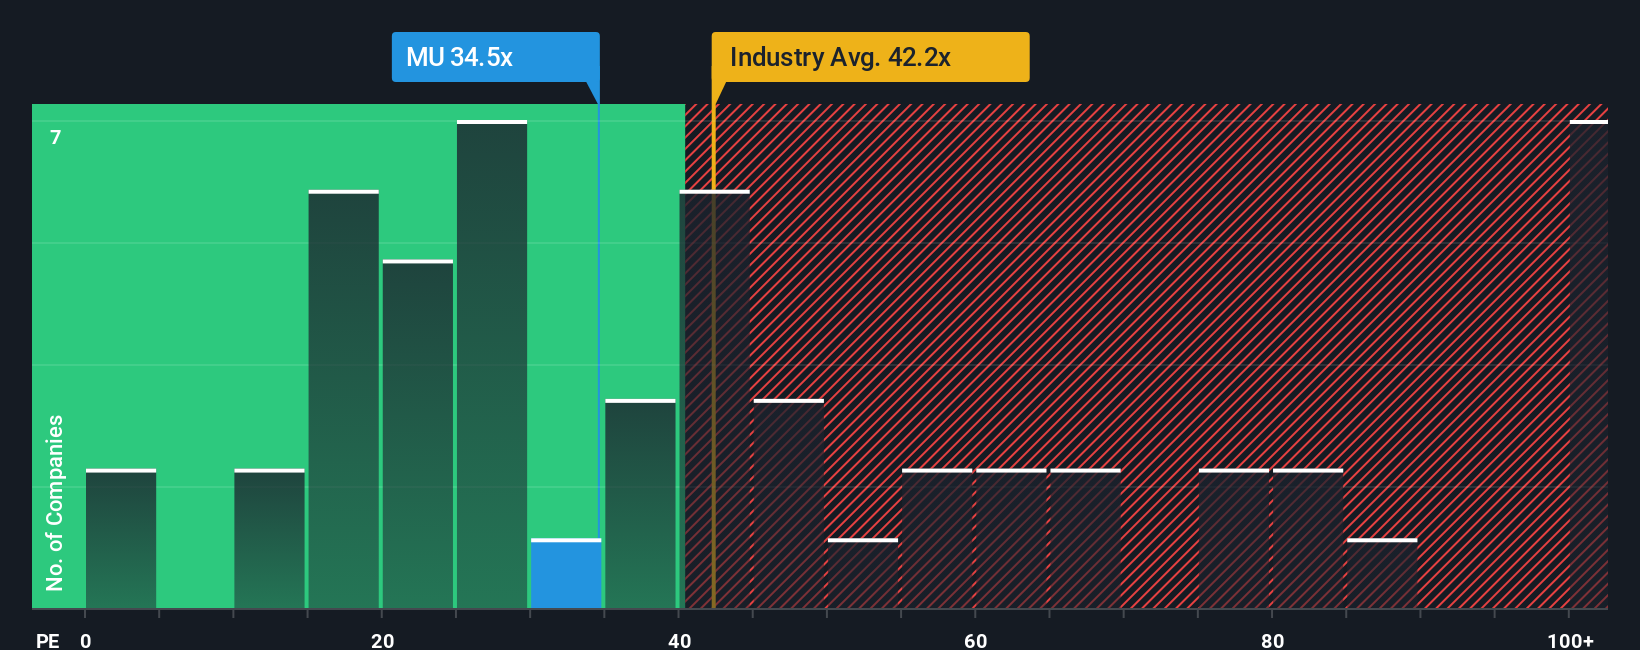
Importantly, a “normal” or “fair” PE ratio can vary quite a bit based on factors like a company’s expected earnings growth and the risks involved. Faster growth often justifies a higher multiple, whereas greater risks or sluggish growth typically pull that number down. Industry averages offer one useful reference point. For example, the average semiconductor stock in the same sector trades at 35.76x earnings, while Micron’s peers average an even higher 62.79x.
Currently, Micron trades at a PE ratio of 28.66x. To offer a more tailored benchmark, Simply Wall St calculates a proprietary “Fair Ratio” of 42.67x for Micron, which incorporates not just industry context, but also factors like its earnings growth, profit margins, market cap, and unique risk profile. This Fair Ratio paints a clearer picture because it adapts to what truly matters for this specific company, rather than relying solely on generic sector averages or peer comparisons.
Since Micron’s actual PE is meaningfully below its Fair Ratio, this measure suggests the stock may be trading for less than what its fundamentals justify.
Result: UNDERVALUED
PE ratios tell one story, but what if the real opportunity lies elsewhere? Discover 1411 companies where insiders are betting big on explosive growth.
Upgrade Your Decision Making: Choose your Micron Technology Narrative
Earlier we mentioned that there’s an even better way to understand valuation, so let’s introduce you to Narratives. A Narrative is a user-friendly tool that lets you create your own story for a company by outlining your expectations about its future, such as fair value, revenue growth, future earnings, and profit margins, rather than relying solely on historical numbers or analyst consensus.
With Narratives, you link your personal outlook for Micron Technology to a detailed financial forecast, which then flows directly into a dynamic estimate of what you think the stock is really worth. Available on the Simply Wall St Community page and used by millions of investors, Narratives make it easy to visualize and track how your investment thesis compares to others in real time.
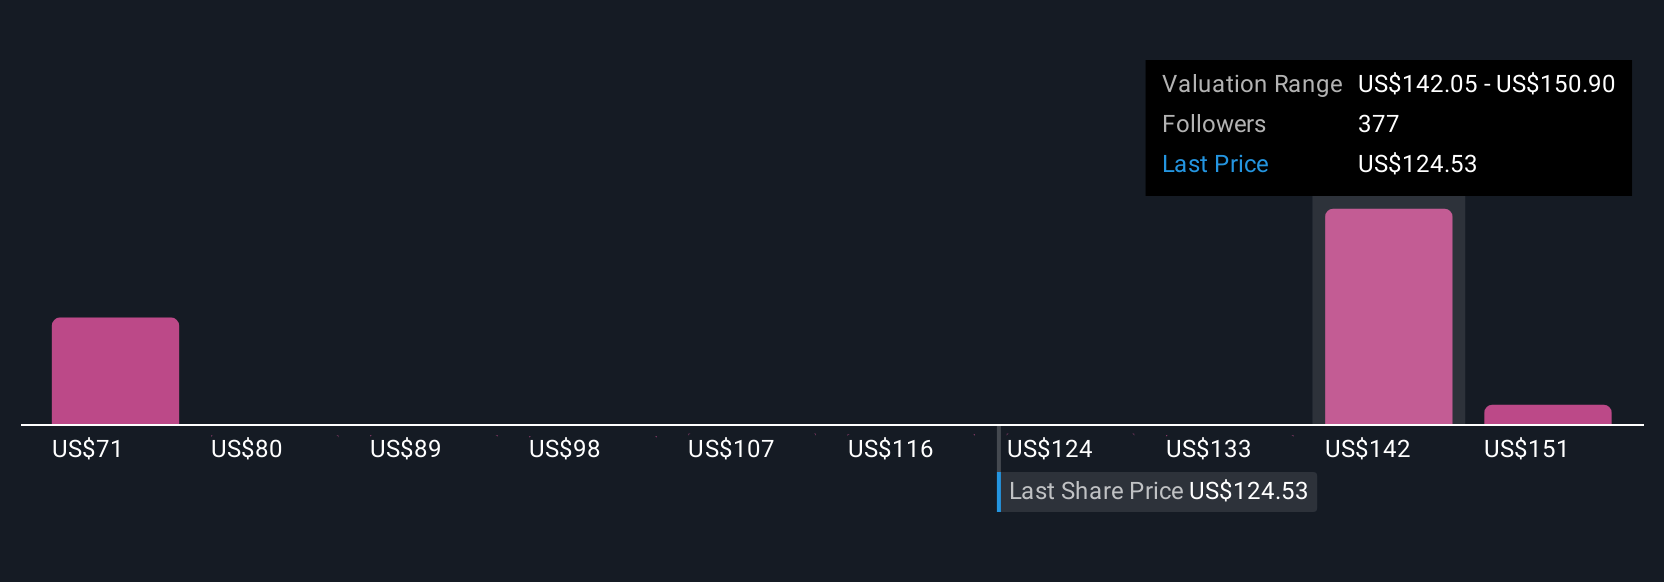
They help you decide when to buy or sell by comparing your Fair Value to the current market Price, and are automatically updated if key data such as earnings reports or news changes the underlying outlook. For example, some investors’ Narratives for Micron assume substantial growth and a fair value over $200 per share, while others see limited upside, valuing it closer to $95. Narratives empower you to reflect your own perspective and make smarter, more confident investment decisions.
Do you think there's more to the story for Micron Technology? Head over to our Community to see what others are saying!
This article by Simply Wall St is general in nature. We provide commentary based on historical data and analyst forecasts only using an unbiased methodology and our articles are not intended to be financial advice. It does not constitute a recommendation to buy or sell any stock, and does not take account of your objectives, or your financial situation. We aim to bring you long-term focused analysis driven by fundamental data. Note that our analysis may not factor in the latest price-sensitive company announcements or qualitative material. Simply Wall St has no position in any stocks mentioned.
Have feedback on this article? Concerned about the content? Get in touch with us directly. Alternatively, email editorial-team@simplywallst.com
Contact Us
Contact Number : +852 3852 8500Service Email : service@webull.hkBusiness Cooperation : marketinghk@webull.hkWebull Securities Limited is licensed with the Securities and Futures Commission of Hong Kong (CE No. BNG700) for carrying out Type 1 License for Dealing in Securities, Type 2 License for Dealing in Futures Contracts and Type 4 License for Advising on Securities.

English