
Returns On Capital At Sam Woo Construction Group (HKG:3822) Paint A Concerning Picture
If we're looking to avoid a business that is in decline, what are the trends that can warn us ahead of time? When we see a declining return on capital employed (ROCE) in conjunction with a declining base of capital employed, that's often how a mature business shows signs of aging. Basically the company is earning less on its investments and it is also reducing its total assets. On that note, looking into Sam Woo Construction Group (HKG:3822), we weren't too upbeat about how things were going.
What Is Return On Capital Employed (ROCE)?
If you haven't worked with ROCE before, it measures the 'return' (pre-tax profit) a company generates from capital employed in its business. Analysts use this formula to calculate it for Sam Woo Construction Group:
Return on Capital Employed = Earnings Before Interest and Tax (EBIT) ÷ (Total Assets - Current Liabilities)
0.053 = HK$29m ÷ (HK$921m - HK$380m) (Based on the trailing twelve months to March 2025).
So, Sam Woo Construction Group has an ROCE of 5.3%. On its own that's a low return on capital but it's in line with the industry's average returns of 5.1%.
Check out our latest analysis for Sam Woo Construction Group
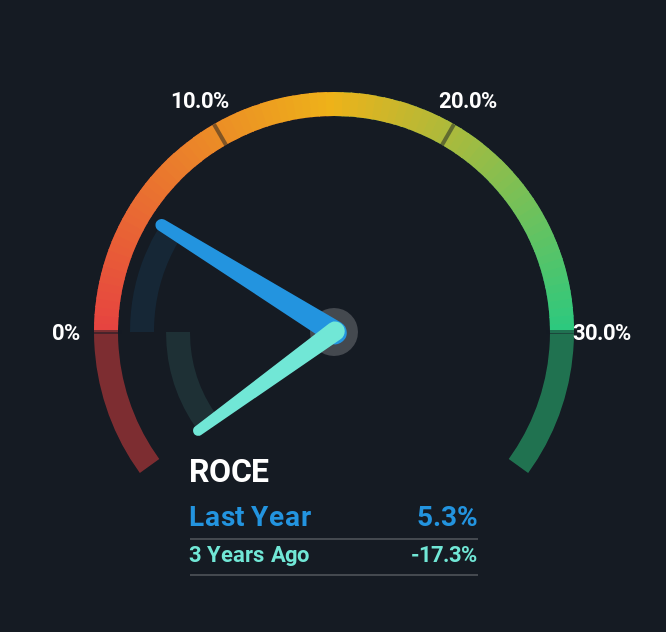
Historical performance is a great place to start when researching a stock so above you can see the gauge for Sam Woo Construction Group's ROCE against it's prior returns. If you'd like to look at how Sam Woo Construction Group has performed in the past in other metrics, you can view this free graph of Sam Woo Construction Group's past earnings, revenue and cash flow.
How Are Returns Trending?
In terms of Sam Woo Construction Group's historical ROCE trend, it isn't fantastic. The company used to generate 11% on its capital five years ago but it has since fallen noticeably. What's equally concerning is that the amount of capital deployed in the business has shrunk by 29% over that same period. The fact that both are shrinking is an indication that the business is going through some tough times. If these underlying trends continue, we wouldn't be too optimistic going forward.
On a side note, Sam Woo Construction Group's current liabilities have increased over the last five years to 41% of total assets, effectively distorting the ROCE to some degree. If current liabilities hadn't increased as much as they did, the ROCE could actually be even lower. And with current liabilities at these levels, suppliers or short-term creditors are effectively funding a large part of the business, which can introduce some risks.
In Conclusion...
In summary, it's unfortunate that Sam Woo Construction Group is shrinking its capital base and also generating lower returns. Long term shareholders who've owned the stock over the last five years have experienced a 51% depreciation in their investment, so it appears the market might not like these trends either. That being the case, unless the underlying trends revert to a more positive trajectory, we'd consider looking elsewhere.
Sam Woo Construction Group does have some risks, we noticed 3 warning signs (and 2 which are a bit unpleasant) we think you should know about.
If you want to search for solid companies with great earnings, check out this free list of companies with good balance sheets and impressive returns on equity.
Have feedback on this article? Concerned about the content? Get in touch with us directly. Alternatively, email editorial-team (at) simplywallst.com.
This article by Simply Wall St is general in nature. We provide commentary based on historical data and analyst forecasts only using an unbiased methodology and our articles are not intended to be financial advice. It does not constitute a recommendation to buy or sell any stock, and does not take account of your objectives, or your financial situation. We aim to bring you long-term focused analysis driven by fundamental data. Note that our analysis may not factor in the latest price-sensitive company announcements or qualitative material. Simply Wall St has no position in any stocks mentioned.
Contact Us
Contact Number : +852 3852 8500Service Email : service@webull.hkBusiness Cooperation : marketinghk@webull.hkWebull Securities Limited is licensed with the Securities and Futures Commission of Hong Kong (CE No. BNG700) for carrying out Type 1 License for Dealing in Securities, Type 2 License for Dealing in Futures Contracts and Type 4 License for Advising on Securities.

English