
Shenzhen Hipine Precision Technology And 2 Other Asian Hidden Gems With Strong Fundamentals
As global markets grapple with concerns over AI-related valuations and fluctuating economic indicators, the Asian stock landscape presents a unique set of opportunities for investors seeking growth potential in small-cap companies. Amidst this backdrop, identifying stocks with strong fundamentals becomes crucial, as they offer resilience and potential stability in an otherwise volatile environment.
Top 10 Undiscovered Gems With Strong Fundamentals In Asia
| Name | Debt To Equity | Revenue Growth | Earnings Growth | Health Rating |
|---|---|---|---|---|
| Konishi | 0.13% | 1.57% | 10.10% | ★★★★★★ |
| YagiLtd | 27.83% | -6.06% | 32.03% | ★★★★★★ |
| Maezawa Kasei Industries | 0.77% | 3.52% | 20.55% | ★★★★★★ |
| Ohashi Technica | NA | 6.82% | -2.11% | ★★★★★★ |
| DoshishaLtd | NA | 3.17% | 3.20% | ★★★★★★ |
| Saison Technology | NA | 1.32% | -10.74% | ★★★★★★ |
| FALCO HOLDINGS | 4.59% | -1.20% | -5.35% | ★★★★★★ |
| Otec | 8.45% | 6.58% | 18.86% | ★★★★★☆ |
| First Juken | 38.99% | -2.43% | 3.16% | ★★★★★☆ |
| Nippon Care Supply | 12.39% | 10.40% | 1.75% | ★★★★☆☆ |
Here we highlight a subset of our preferred stocks from the screener.
Shenzhen Hipine Precision Technology (SEHK:2583)
Simply Wall St Value Rating: ★★★★☆☆
Overview: Shenzhen Hipine Precision Technology Co., Ltd. operates in the precision technology sector with a market capitalization of approximately HK$10.76 billion.
Operations: Shenzhen Hipine Precision Technology generates revenue primarily from its Jewelry & Watches segment, which amounted to CN¥518.07 million. The company's market capitalization is approximately HK$10.76 billion.
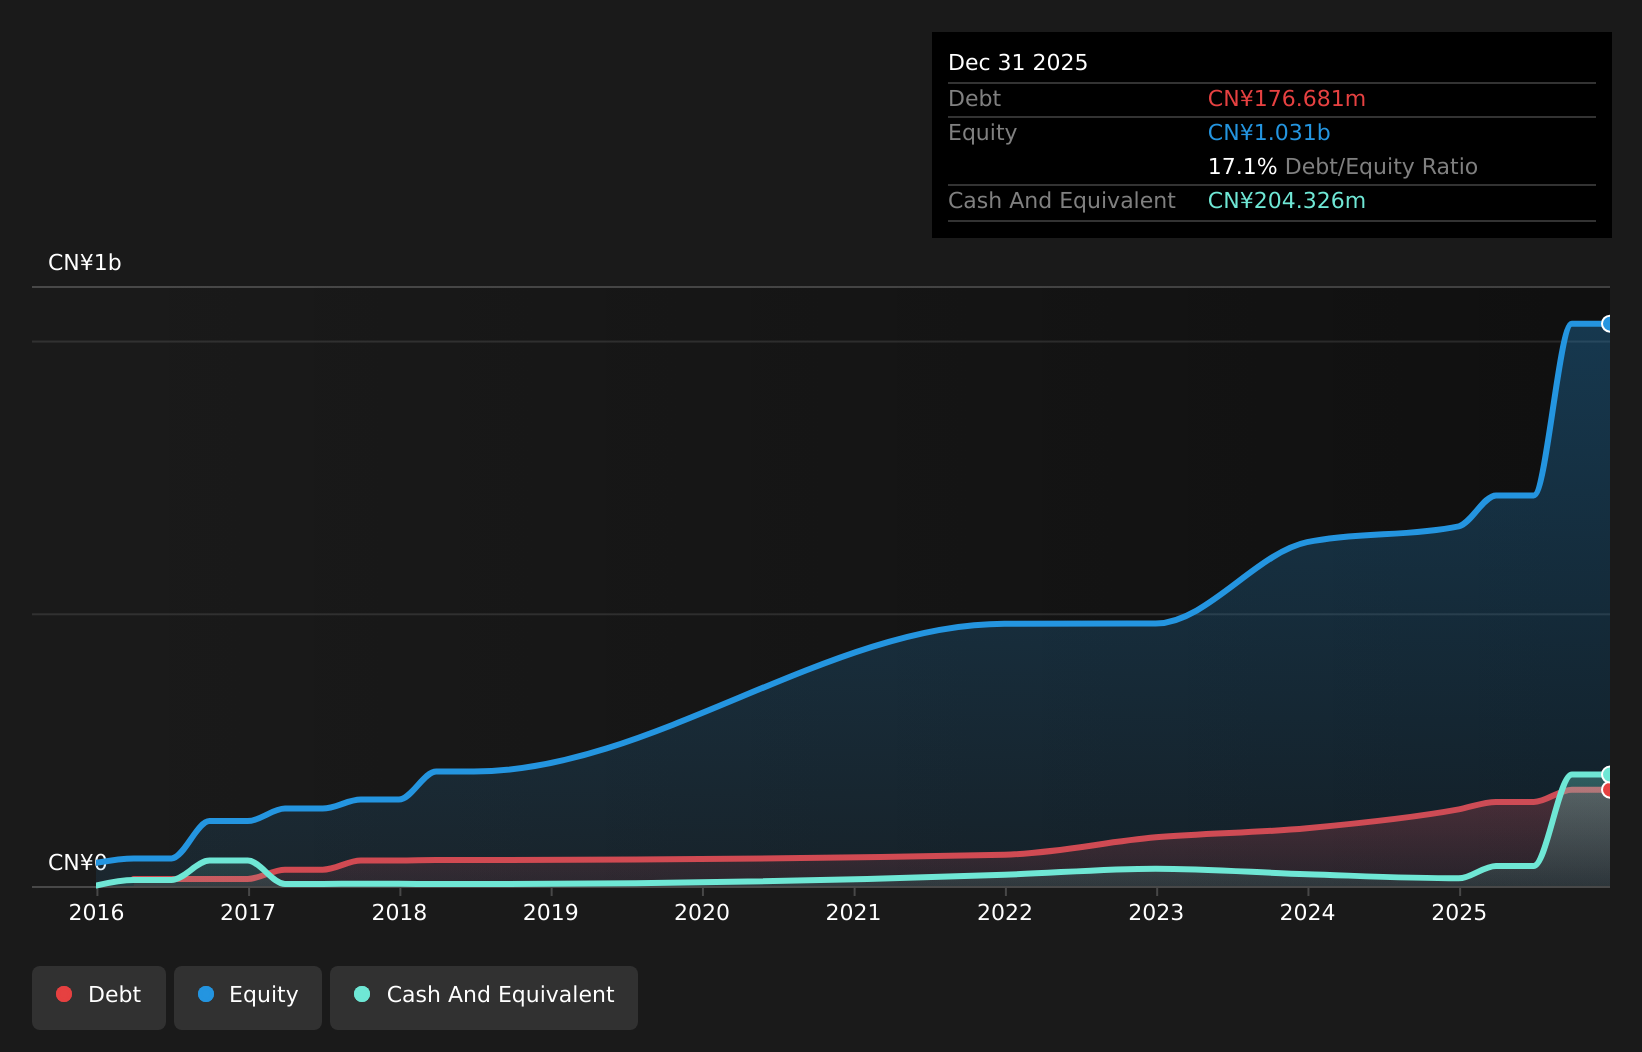
Shenzhen Hipine Precision Technology has been making waves with a recent IPO raising HKD 313.76 million, reflecting investor confidence despite its highly volatile share price in the past three months. The company reported impressive earnings growth of 55%, outpacing the Luxury industry's 5% growth rate, and boasts high-quality earnings. Its net debt to equity ratio at 16% is satisfactory, ensuring financial stability while interest payments are well covered by EBIT at a robust 25.5x coverage. However, it's not free cash flow positive yet, which might be an area to watch as it navigates future opportunities.
Haian Rubber Group (SZSE:001233)
Simply Wall St Value Rating: ★★★★★☆
Overview: Haian Rubber Group Co., Ltd. specializes in the manufacturing and distribution of radial OTR tires, with a market capitalization of approximately CN¥6.70 billion.
Operations: Haian Rubber Group generates revenue primarily from the manufacturing and distribution of radial OTR tires. The company has a market capitalization of approximately CN¥6.70 billion.
Haian Rubber Group, a nimble player in the rubber industry, recently completed an IPO raising CNY 2.23 billion, indicating strong market interest. However, its recent earnings report paints a mixed picture with third-quarter sales at CNY 539 million compared to last year's CNY 629 million. Net income also dipped to CNY 121 million from CNY 198 million over the same period. Despite this, Haian boasts high-quality past earnings and maintains more cash than total debt, suggesting financial resilience. Its shares are quite illiquid though, which could pose challenges for potential investors seeking liquidity in their investments.

Shinkong Textile (TWSE:1419)
Simply Wall St Value Rating: ★★★★★☆
Overview: Shinkong Textile Co., Ltd. is involved in the production and sale of synthetic fibers, fabrics, and finished fabrics both domestically in Taiwan and internationally, with a market cap of NT$22.14 billion.
Operations: Shinkong Textile generates revenue through the sale of synthetic fibers, fabrics, and finished fabrics both in Taiwan and abroad. The company's net profit margin has shown variability over recent periods.
Shinkong Textile's recent performance highlights its potential as an investment opportunity. With earnings growth of 107.5% over the past year, it outpaces the luxury industry's -11% decline, showcasing robust financial health. The company's net debt to equity ratio stands at a satisfactory 15.2%, indicating prudent financial management, while its price-to-earnings ratio of 16.6x remains attractive compared to the TW market average of 19.5x. Despite a volatile share price in recent months, Shinkong's inclusion in the S&P Global BMI Index and impressive net income growth from TWD 239.63 million to TWD 585.94 million suggest promising prospects ahead.
- Click to explore a detailed breakdown of our findings in Shinkong Textile's health report.
Explore historical data to track Shinkong Textile's performance over time in our Past section.

Make It Happen
- Discover the full array of 2486 Asian Undiscovered Gems With Strong Fundamentals right here.
- Already own these companies? Link your portfolio to Simply Wall St and get alerts on any new warning signs to your stocks.
- Invest smarter with the free Simply Wall St app providing detailed insights into every stock market around the globe.
Searching for a Fresh Perspective?
- Explore high-performing small cap companies that haven't yet garnered significant analyst attention.
- Fuel your portfolio with companies showing strong growth potential, backed by optimistic outlooks both from analysts and management.
- Find companies with promising cash flow potential yet trading below their fair value.
This article by Simply Wall St is general in nature. We provide commentary based on historical data and analyst forecasts only using an unbiased methodology and our articles are not intended to be financial advice. It does not constitute a recommendation to buy or sell any stock, and does not take account of your objectives, or your financial situation. We aim to bring you long-term focused analysis driven by fundamental data. Note that our analysis may not factor in the latest price-sensitive company announcements or qualitative material. Simply Wall St has no position in any stocks mentioned.
Have feedback on this article? Concerned about the content? Get in touch with us directly. Alternatively, email editorial-team@simplywallst.com
Contact Us
Contact Number :+852 3852 8500Webull Securities Limited is licensed with the Securities and Futures Commission of Hong Kong (CE No. BNG700) for carrying out Type 1 License for Dealing in Securities, Type 2 License for Dealing in Futures Contracts and Type 4 License for Advising on Securities.

English