
Is Diebold Nixdorf’s 52% Rally Backed by Real Value After Partnerships and Restructuring?
- Wondering if Diebold Nixdorf is a hidden value play or simply riding a hot streak? Let’s dig into what’s really behind those numbers.
- In just the past month, Diebold Nixdorf’s stock has surged 10.2%, with year-to-date gains now at an impressive 52.1% and a strong 39.0% return over the past year.
- Much of this momentum comes in the wake of high-profile partnerships and major restructuring efforts that have caught investors’ attention and driven renewed optimism. Specifically, recent headlines have spotlighted the company’s moves to streamline operations and roll out new technology collaborations.
- All this action leaves Diebold Nixdorf with a valuation score of 3 out of 6, which is right in the middle of the pack according to the usual checks. Next, we’ll break down those valuation approaches and, at the end, reveal a smarter way to get the full picture of the stock’s worth.
Approach 1: Diebold Nixdorf Discounted Cash Flow (DCF) Analysis
A Discounted Cash Flow (DCF) analysis estimates a company’s intrinsic value by projecting its future cash flows and then discounting those projections back to today’s value. This method helps investors see what a stock might really be worth based on its expected ability to generate cash in the years ahead.
For Diebold Nixdorf, the current Free Cash Flow stands at approximately $232 million. Analysts forecast moderate growth in these cash flows, with projections suggesting that by 2026, the annual Free Cash Flow could reach $248.3 million. Looking even further ahead, extrapolations point to Free Cash Flow potentially hitting around $343.9 million by 2035.
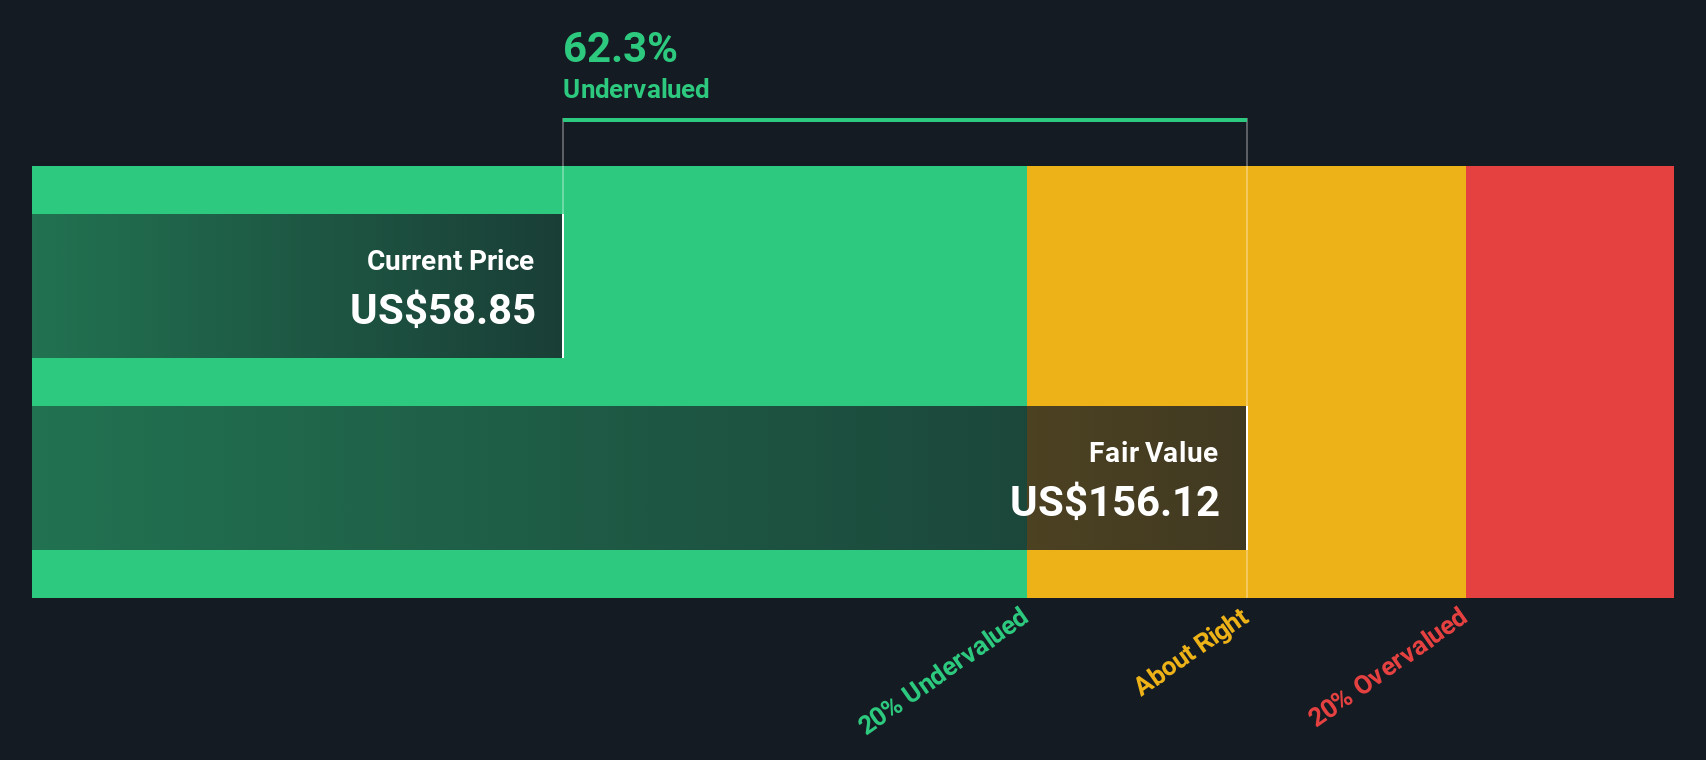
Applying the DCF model, these future cash flows are discounted to reflect today’s dollars. This calculation results in an estimated intrinsic value of $115.35 per share. According to these figures, the stock is trading at a 43.9% discount to its underlying value, suggesting that the DCF analysis views the stock as having notable upside potential compared to the current market price.
Result: UNDERVALUED
Our Discounted Cash Flow (DCF) analysis suggests Diebold Nixdorf is undervalued by 43.9%. Track this in your watchlist or portfolio, or discover 924 more undervalued stocks based on cash flows.
Approach 2: Diebold Nixdorf Price vs Earnings (PE)
The Price-to-Earnings (PE) ratio is a popular valuation method for profitable companies because it links a company’s stock price to its actual earnings. This gives investors a clearer view of how much they are paying for each dollar of profit. A higher PE ratio often signals higher growth expectations or lower perceived risk. In contrast, a lower PE ratio might indicate concerns about growth prospects or increased risk.
Diebold Nixdorf currently trades at a PE ratio of 45.8x. This is significantly higher than both the peer group average of 11.3x and the broader tech industry average of 22.2x. At first glance, such a high PE might raise concerns about whether the stock is overheating, especially considering the company’s recent strong performance and restructuring moves.
However, Simply Wall St’s “Fair Ratio” provides a more tailored benchmark by accounting for specifics like earnings growth, industry landscape, profitability, company size, and risks. For Diebold Nixdorf, the Fair Ratio is 42.1x, making it a more accurate reflection of what investors should reasonably pay per dollar of earnings given its circumstances.
Unlike peer or industry comparisons, the Fair Ratio evaluates the company on a holistic basis. This helps identify if the current price reflects unique opportunities or pitfalls instead of relying on less nuanced benchmarks.
With a current PE ratio at 45.8x and a Fair Ratio of 42.1x, Diebold Nixdorf appears slightly overvalued on this metric, but the difference is not extreme.
Result: OVERVALUED

PE ratios tell one story, but what if the real opportunity lies elsewhere? Discover 1432 companies where insiders are betting big on explosive growth.
Upgrade Your Decision Making: Choose your Diebold Nixdorf Narrative
Earlier we mentioned that there's an even better way to understand valuation. Let's introduce you to Narratives. In simple terms, a Narrative is your personal take on a company, combining the story you believe about its business with your assumptions about future revenue, earnings, and margins, leading to your own estimate of fair value. Narratives transform raw numbers into a meaningful outlook by linking a company’s journey, your financial forecast, and the price you think is fair.
On Simply Wall St’s Community page, creating or exploring Narratives is easy and accessible, used by millions of investors worldwide. Narratives help you decide when to buy or sell by comparing your Fair Value to the current share price and stay up to date automatically as new earnings, news, or market events emerge.
For example, two investors might see Diebold Nixdorf very differently. One, focusing on growth from advanced ATMs and global retail expansion, could give a Fair Value near $115 per share. Another, concerned about digital banking disruption and lagging margin gains, might see the company’s fair worth closer to $60. Narratives let you anchor your investment approach in your own perspective, informed and adaptable as the company’s story evolves.
Do you think there's more to the story for Diebold Nixdorf? Head over to our Community to see what others are saying!
This article by Simply Wall St is general in nature. We provide commentary based on historical data and analyst forecasts only using an unbiased methodology and our articles are not intended to be financial advice. It does not constitute a recommendation to buy or sell any stock, and does not take account of your objectives, or your financial situation. We aim to bring you long-term focused analysis driven by fundamental data. Note that our analysis may not factor in the latest price-sensitive company announcements or qualitative material. Simply Wall St has no position in any stocks mentioned.
Have feedback on this article? Concerned about the content? Get in touch with us directly. Alternatively, email editorial-team@simplywallst.com
Contact Us
Contact Number : +852 3852 8500Webull Securities Limited is licensed with the Securities and Futures Commission of Hong Kong (CE No. BNG700) for carrying out Type 1 License for Dealing in Securities, Type 2 License for Dealing in Futures Contracts and Type 4 License for Advising on Securities.

English