
Interactive Brokers (IBKR): Has the Recent Pullback Opened a Valuation Opportunity?
Why Interactive Brokers Group Has Caught Investors Attention
Interactive Brokers Group (IBKR) has quietly pulled back about 12% over the past month, even after delivering steady revenue and double digit net income growth, a setup that naturally raises valuation questions.
See our latest analysis for Interactive Brokers Group.
That recent 11.8% one month share price pullback sits awkwardly next to a 40.6% year to date share price return and a hefty 275.3% three year total shareholder return, suggesting momentum is cooling but the long term story remains very much intact.
If this kind of compounding performance has your attention, it is worth exploring what else is out there via fast growing stocks with high insider ownership.
With earnings still climbing, a modest value score, and shares trading around 20% below consensus targets, investors now face a key question: is Interactive Brokers a rare mispriced compounder, or is the market already baking in its future growth?
Most Popular Narrative: 16.8% Undervalued
With Interactive Brokers last closing at $64.15 against a narrative fair value near $77, the story hinges on continued growth and unusually rich future multiples.
The ongoing popularity of investing with global interest from investors who increasingly want broad portfolios and international access is expected to drive sustained account growth, attracting both individual and institutional investors and boosting overall revenue.
Want to see what kind of growth roadmap justifies that premium multiple? The narrative leans on rising revenues, resilient margins, and a future earnings power that rivals market darlings. Curious which assumptions really move that fair value dial upward? Dive in to uncover the projections behind this call.
Result: Fair Value of $77.11 (UNDERVALUED)
Have a read of the narrative in full and understand what's behind the forecasts.
However, this upbeat roadmap could easily be knocked off course by weaker trading volumes and interest rate cuts that compress Interactive Brokers net interest income.
Find out about the key risks to this Interactive Brokers Group narrative.
Another Angle on Valuation
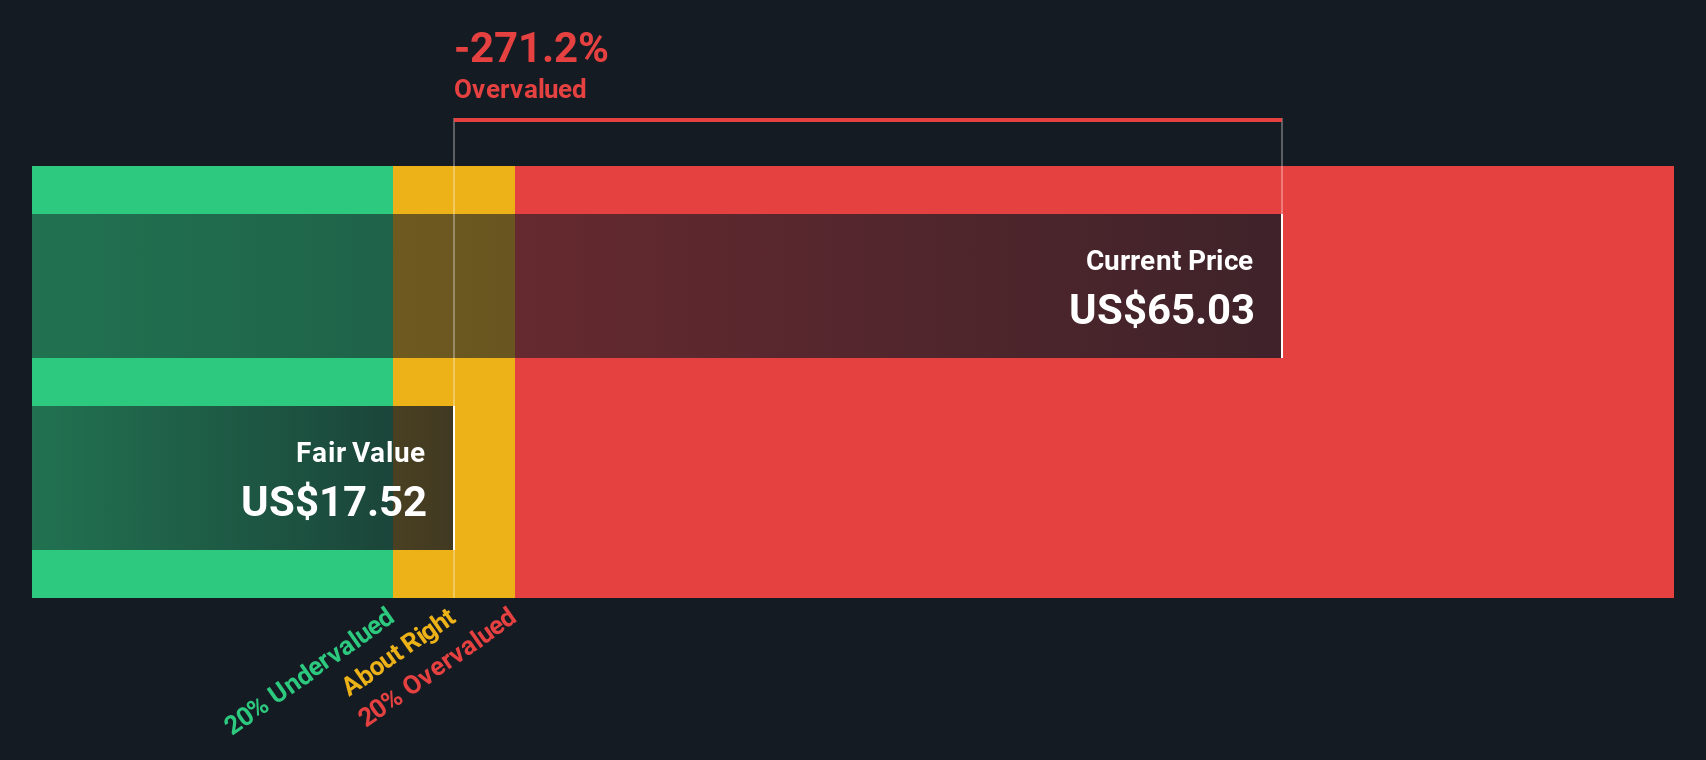
Our SWS DCF model paints a much cooler picture, putting fair value near $34.21, which makes the current $64.15 share price look overvalued rather than cheap. If cash flows point one way and narratives another, which signal deserves more weight in your process?
Look into how the SWS DCF model arrives at its fair value.
Build Your Own Interactive Brokers Group Narrative
If this perspective does not fully align with your view and you would rather investigate the numbers yourself, you can build a custom narrative in just a few minutes, Do it your way.
A great starting point for your Interactive Brokers Group research is our analysis highlighting 3 key rewards and 1 important warning sign that could impact your investment decision.
Ready for more compelling investment ideas?
Before markets move on without you, put Simply Wall Street to work and uncover practical, data backed ideas that could complement or even outperform your current watchlist.
- Target consistent income by scanning these 13 dividend stocks with yields > 3% that aim to balance yield with solid fundamentals and lower the risk of chasing unsustainable payouts.
- Ride structural growth trends by reviewing these 30 healthcare AI stocks that sit at the intersection of medicine, data, and automation, where innovation can translate into durable revenue streams.
- Position early in potential game changers by assessing these 80 cryptocurrency and blockchain stocks that tap into blockchain infrastructure, digital payments, and emerging decentralized applications.
This article by Simply Wall St is general in nature. We provide commentary based on historical data and analyst forecasts only using an unbiased methodology and our articles are not intended to be financial advice. It does not constitute a recommendation to buy or sell any stock, and does not take account of your objectives, or your financial situation. We aim to bring you long-term focused analysis driven by fundamental data. Note that our analysis may not factor in the latest price-sensitive company announcements or qualitative material. Simply Wall St has no position in any stocks mentioned.
Have feedback on this article? Concerned about the content? Get in touch with us directly. Alternatively, email editorial-team@simplywallst.com
Contact Us
Contact Number : +852 3852 8500Webull Securities Limited is licensed with the Securities and Futures Commission of Hong Kong (CE No. BNG700) for carrying out Type 1 License for Dealing in Securities, Type 2 License for Dealing in Futures Contracts and Type 4 License for Advising on Securities.

English