
How Does Brookfield Infrastructure Stack Up After Recent Pullback and DCF Upside in 2025?
- If you are wondering whether Brookfield Infrastructure Partners is reasonably priced or quietly on sale right now, this breakdown will help you decide whether the current share price lines up with its long term cash generating potential.
- The stock has slipped about 3.2% over the last week and 3.7% over the past month, yet it still sits roughly 7.0% higher year to date and about 11.0% above where it was a year ago. This suggests that the longer term story has been more constructive than the recent pullback indicates.
- Recently, the market has been reacting to broader infrastructure and utilities sentiment, including shifting expectations around interest rates and appetite for income focused assets. These factors tend to move stocks like Brookfield Infrastructure even when company specific headlines are quiet. At the same time, ongoing discussions about global spending on energy transition and digital infrastructure have kept long term investors focused on the partnership's pipeline and asset mix. This helps explain why the share price has held on to its multi year gains despite short term volatility.
- On our checks, Brookfield Infrastructure Partners currently earns a 3/6 valuation score, suggesting it looks undervalued on some metrics but not across the board. In the sections that follow, we will unpack what different valuation approaches say about that gap, before finishing with a more holistic way to think about its true worth.
Approach 1: Brookfield Infrastructure Partners Discounted Cash Flow (DCF) Analysis
A Discounted Cash Flow (DCF) model estimates what a business is worth by projecting the cash it can generate in the future and discounting those cash flows back to today in $ terms.
For Brookfield Infrastructure Partners, the model used is a 2 Stage Free Cash Flow to Equity approach. The partnership has generated trailing twelve month free cash flow of about $952 million, and analysts plus internal forecasts see this rising substantially over time. For example, Simply Wall St aggregates analyst inputs and extrapolations to project free cash flow reaching roughly $5.3 billion by 2029, with further steady growth in the following years as its regulated and contracted assets mature.
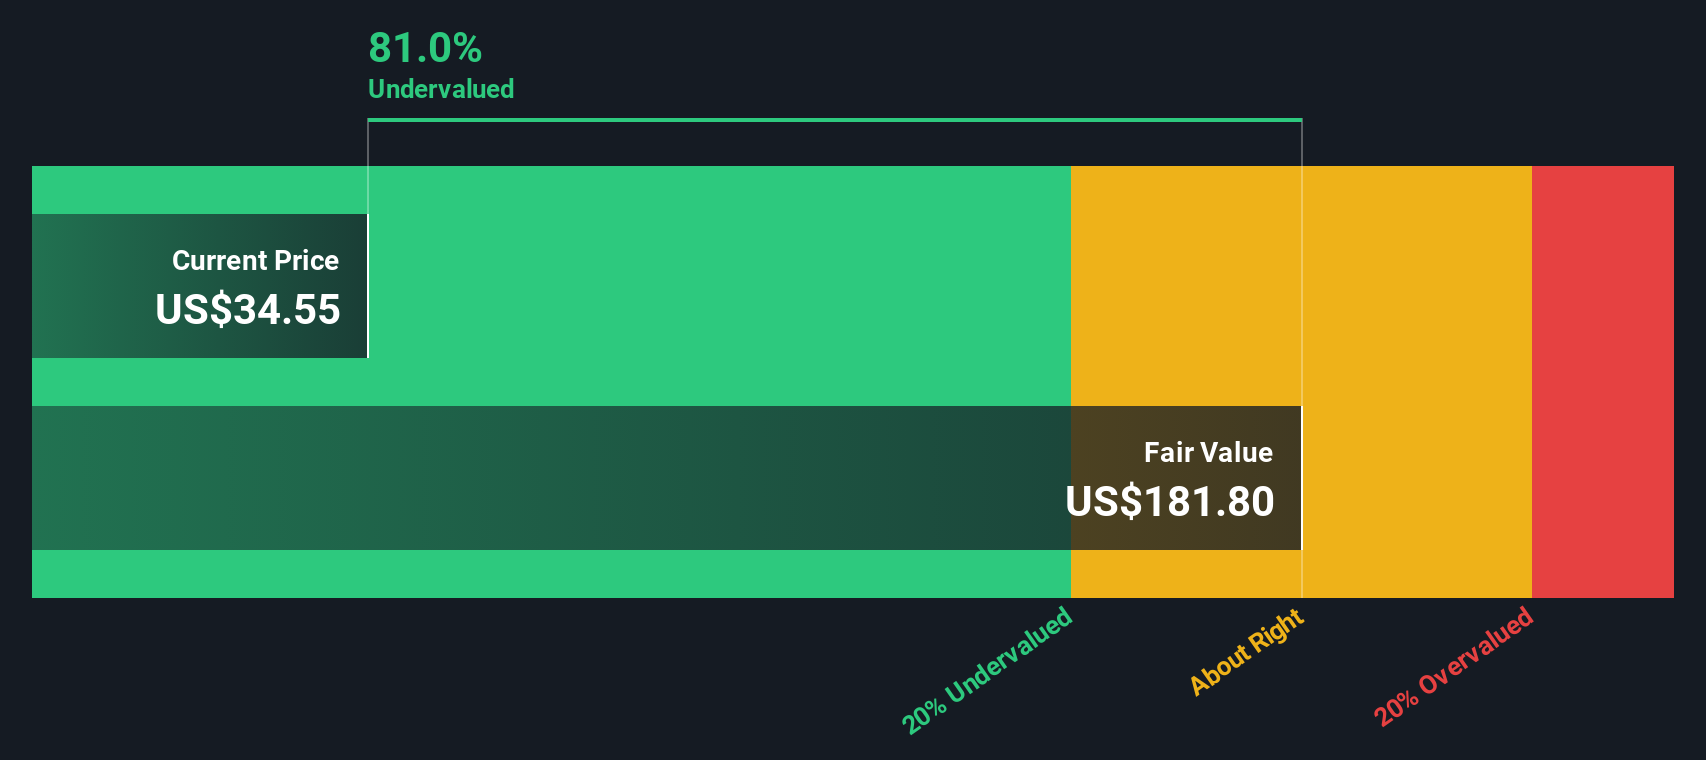
When all those projected cash flows are discounted back to today, the DCF model arrives at an intrinsic value of about $159.82 per unit. Compared with the current trading price, this implies the units are trading at a 78.7% discount to estimated fair value. This suggests the market is pricing in much weaker long term cash generation than the model assumes.
Result: UNDERVALUED
Our Discounted Cash Flow (DCF) analysis suggests Brookfield Infrastructure Partners is undervalued by 78.7%. Track this in your watchlist or portfolio, or discover 903 more undervalued stocks based on cash flows.
Approach 2: Brookfield Infrastructure Partners Price vs Earnings
For profitable businesses like Brookfield Infrastructure Partners, the price to earnings (PE) ratio is a handy shorthand for what investors are willing to pay today for each dollar of current earnings. That willingness usually depends on how quickly earnings are expected to grow and how risky those earnings are. Faster, more reliable growth typically justifies a higher PE, while slower or more volatile earnings usually command a lower one.
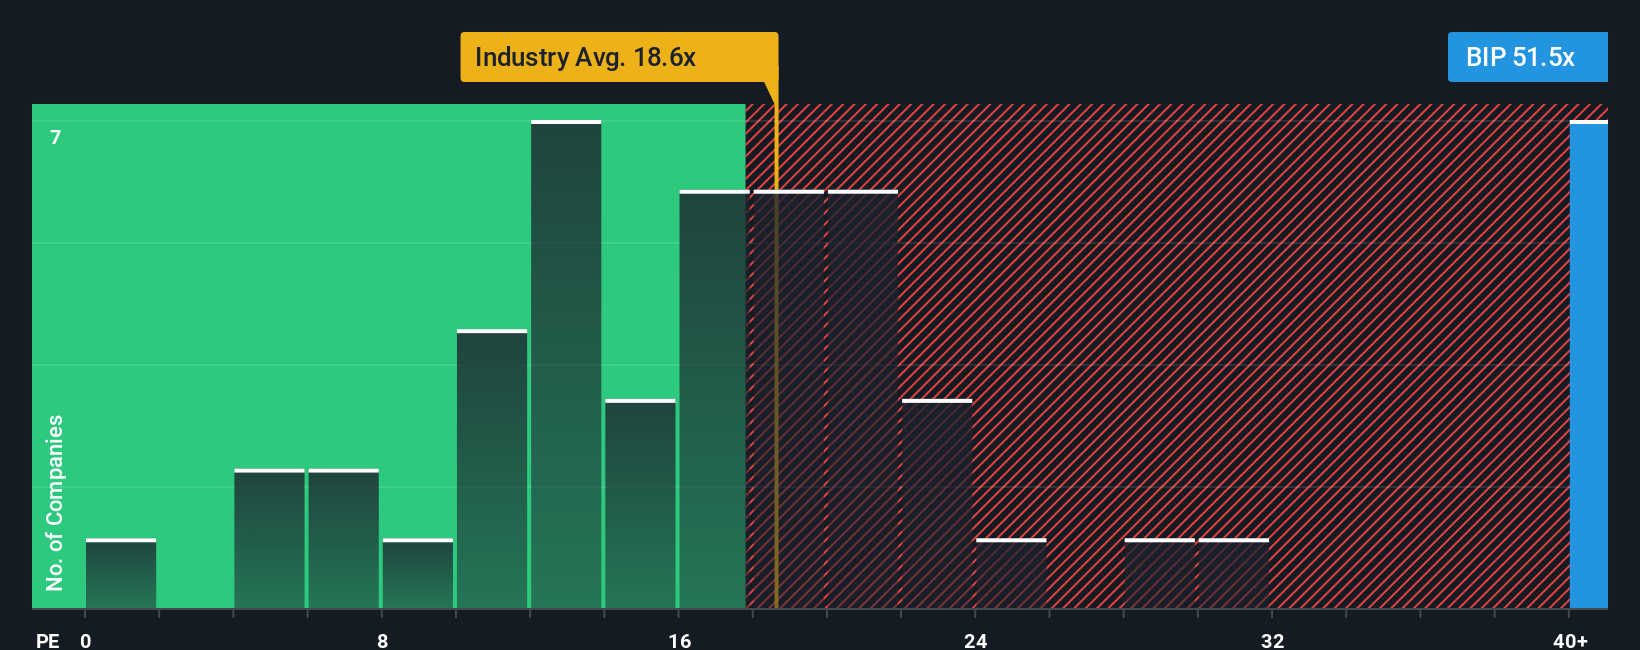
Brookfield Infrastructure currently trades on a PE of about 48.7x, which is well above both the integrated utilities industry average of roughly 17.9x and the broader peer group average of about 21.5x. On the face of it, that suggests the market is assigning a substantial premium to the partnership compared with similar companies.
Simply Wall St also uses a Fair Ratio, its proprietary view of what a more appropriate PE might be once factors like earnings growth, risk profile, profit margins, industry characteristics and market cap are all accounted for. For Brookfield Infrastructure, that Fair Ratio is around 1.26x, implying that, on a risk and growth adjusted basis, the current market multiple looks rich. On this basis, the stock screens as meaningfully overvalued relative to its fundamentals.
Result: OVERVALUED
PE ratios tell one story, but what if the real opportunity lies elsewhere? Discover 1447 companies where insiders are betting big on explosive growth.
Upgrade Your Decision Making: Choose your Brookfield Infrastructure Partners Narrative
Earlier we mentioned that there is an even better way to understand valuation. So let's introduce you to Narratives, a simple tool on Simply Wall St's Community page that lets you turn your view of Brookfield Infrastructure Partners into a clear story that links its business drivers to a financial forecast, and then to a Fair Value you can compare with the current price. This can help you decide whether to buy or sell. The platform continuously updates that Narrative as new news or earnings arrive so you can see, for example, how one investor might build a bullish Brookfield Infrastructure Partners Narrative around strong, inflation linked digital and energy infrastructure growth and reach a Fair Value near the high analyst target of about $53. Another investor might focus on regulatory and leverage risks and land closer to the low target near $31. This gives you a dynamic, side by side sense of where your own assumptions sit.
Do you think there's more to the story for Brookfield Infrastructure Partners? Head over to our Community to see what others are saying!

This article by Simply Wall St is general in nature. We provide commentary based on historical data and analyst forecasts only using an unbiased methodology and our articles are not intended to be financial advice. It does not constitute a recommendation to buy or sell any stock, and does not take account of your objectives, or your financial situation. We aim to bring you long-term focused analysis driven by fundamental data. Note that our analysis may not factor in the latest price-sensitive company announcements or qualitative material. Simply Wall St has no position in any stocks mentioned.
Have feedback on this article? Concerned about the content? Get in touch with us directly. Alternatively, email editorial-team@simplywallst.com
Contact Us
Contact Number : +852 3852 8500Webull Securities Limited is licensed with the Securities and Futures Commission of Hong Kong (CE No. BNG700) for carrying out Type 1 License for Dealing in Securities, Type 2 License for Dealing in Futures Contracts and Type 4 License for Advising on Securities.

English