
Some Confidence Is Lacking In China Tianrui Automotive Interiors Co., LTD (HKG:6162) As Shares Slide 27%
The China Tianrui Automotive Interiors Co., LTD (HKG:6162) share price has softened a substantial 27% over the previous 30 days, handing back much of the gains the stock has made lately. Nonetheless, the last 30 days have barely left a scratch on the stock's annual performance, which is up a whopping 529%.
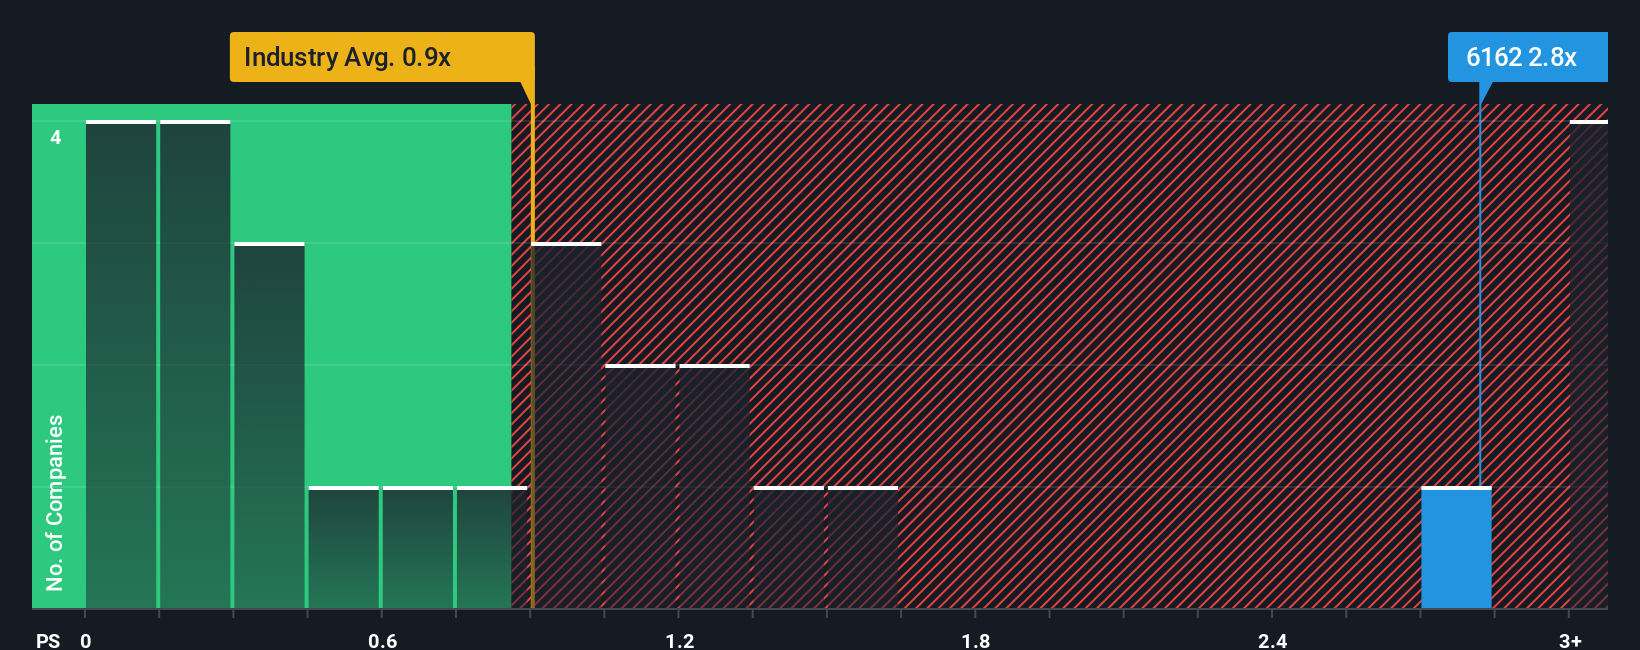
In spite of the heavy fall in price, you could still be forgiven for thinking China Tianrui Automotive Interiors is a stock not worth researching with a price-to-sales ratios (or "P/S") of 2.8x, considering almost half the companies in Hong Kong's Auto Components industry have P/S ratios below 0.9x. Although, it's not wise to just take the P/S at face value as there may be an explanation why it's as high as it is.
View our latest analysis for China Tianrui Automotive Interiors
How China Tianrui Automotive Interiors Has Been Performing
China Tianrui Automotive Interiors has been doing a good job lately as it's been growing revenue at a solid pace. One possibility is that the P/S ratio is high because investors think this respectable revenue growth will be enough to outperform the broader industry in the near future. However, if this isn't the case, investors might get caught out paying too much for the stock.
Want the full picture on earnings, revenue and cash flow for the company? Then our free report on China Tianrui Automotive Interiors will help you shine a light on its historical performance.What Are Revenue Growth Metrics Telling Us About The High P/S?
In order to justify its P/S ratio, China Tianrui Automotive Interiors would need to produce impressive growth in excess of the industry.
Retrospectively, the last year delivered an exceptional 24% gain to the company's top line. The latest three year period has also seen an excellent 80% overall rise in revenue, aided by its short-term performance. So we can start by confirming that the company has done a great job of growing revenue over that time.
Comparing the recent medium-term revenue trends against the industry's one-year growth forecast of 29% shows it's noticeably less attractive.
With this information, we find it concerning that China Tianrui Automotive Interiors is trading at a P/S higher than the industry. It seems most investors are ignoring the fairly limited recent growth rates and are hoping for a turnaround in the company's business prospects. There's a good chance existing shareholders are setting themselves up for future disappointment if the P/S falls to levels more in line with recent growth rates.
What Does China Tianrui Automotive Interiors' P/S Mean For Investors?
There's still some elevation in China Tianrui Automotive Interiors' P/S, even if the same can't be said for its share price recently. Typically, we'd caution against reading too much into price-to-sales ratios when settling on investment decisions, though it can reveal plenty about what other market participants think about the company.
Our examination of China Tianrui Automotive Interiors revealed its poor three-year revenue trends aren't detracting from the P/S as much as we though, given they look worse than current industry expectations. When we observe slower-than-industry revenue growth alongside a high P/S ratio, we assume there to be a significant risk of the share price decreasing, which would result in a lower P/S ratio. Unless there is a significant improvement in the company's medium-term performance, it will be difficult to prevent the P/S ratio from declining to a more reasonable level.
It's always necessary to consider the ever-present spectre of investment risk. We've identified 2 warning signs with China Tianrui Automotive Interiors, and understanding these should be part of your investment process.
It's important to make sure you look for a great company, not just the first idea you come across. So if growing profitability aligns with your idea of a great company, take a peek at this free list of interesting companies with strong recent earnings growth (and a low P/E).
Have feedback on this article? Concerned about the content? Get in touch with us directly. Alternatively, email editorial-team (at) simplywallst.com.
This article by Simply Wall St is general in nature. We provide commentary based on historical data and analyst forecasts only using an unbiased methodology and our articles are not intended to be financial advice. It does not constitute a recommendation to buy or sell any stock, and does not take account of your objectives, or your financial situation. We aim to bring you long-term focused analysis driven by fundamental data. Note that our analysis may not factor in the latest price-sensitive company announcements or qualitative material. Simply Wall St has no position in any stocks mentioned.
Contact Us
Contact Number :+852 3852 8500Webull Securities Limited is licensed with the Securities and Futures Commission of Hong Kong (CE No. BNG700) for carrying out Type 1 License for Dealing in Securities, Type 2 License for Dealing in Futures Contracts and Type 4 License for Advising on Securities.

English