
E&P Global Holdings Limited's (HKG:1142) stock price dropped 10.0% last week; individual investors would not be happy
Key Insights
- E&P Global Holdings' significant individual investors ownership suggests that the key decisions are influenced by shareholders from the larger public
- A total of 8 investors have a majority stake in the company with 49% ownership
- 39% of E&P Global Holdings is held by insiders
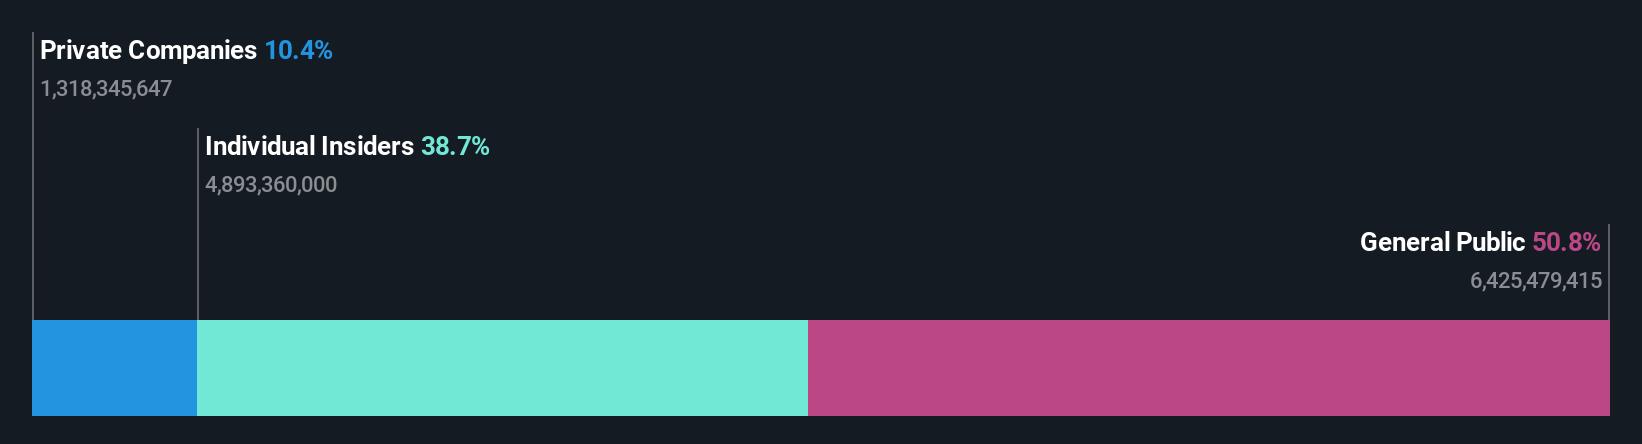
Every investor in E&P Global Holdings Limited (HKG:1142) should be aware of the most powerful shareholder groups. We can see that individual investors own the lion's share in the company with 51% ownership. That is, the group stands to benefit the most if the stock rises (or lose the most if there is a downturn).
While the holdings of individual investors took a hit after last week’s 10.0% price drop, insiders with their 39% also suffered.
In the chart below, we zoom in on the different ownership groups of E&P Global Holdings.
Check out our latest analysis for E&P Global Holdings
What Does The Lack Of Institutional Ownership Tell Us About E&P Global Holdings?
We don't tend to see institutional investors holding stock of companies that are very risky, thinly traded, or very small. Though we do sometimes see large companies without institutions on the register, it's not particularly common.
There could be various reasons why no institutions own shares in a company. Typically, small, newly listed companies don't attract much attention from fund managers, because it would not be possible for large fund managers to build a meaningful position in the company. It is also possible that fund managers don't own the stock because they aren't convinced it will perform well. Institutional investors may not find the historic growth of the business impressive, or there might be other factors at play. You can see the past revenue performance of E&P Global Holdings, for yourself, below.

Hedge funds don't have many shares in E&P Global Holdings. Looking at our data, we can see that the largest shareholder is Hon Lam Chen with 28% of shares outstanding. Jin Xin (PTC) Limited is the second largest shareholder owning 9.9% of common stock, and Wilson Wong holds about 4.9% of the company stock.
Our studies suggest that the top 8 shareholders collectively control less than half of the company's shares, meaning that the company's shares are widely disseminated and there is no dominant shareholder.
While studying institutional ownership for a company can add value to your research, it is also a good practice to research analyst recommendations to get a deeper understand of a stock's expected performance. As far as we can tell there isn't analyst coverage of the company, so it is probably flying under the radar.
Insider Ownership Of E&P Global Holdings
While the precise definition of an insider can be subjective, almost everyone considers board members to be insiders. The company management answer to the board and the latter should represent the interests of shareholders. Notably, sometimes top-level managers are on the board themselves.
Insider ownership is positive when it signals leadership are thinking like the true owners of the company. However, high insider ownership can also give immense power to a small group within the company. This can be negative in some circumstances.
Our information suggests that insiders maintain a significant holding in E&P Global Holdings Limited. Insiders own HK$1.1b worth of shares in the HK$2.7b company. This may suggest that the founders still own a lot of shares. You can click here to see if they have been buying or selling.
General Public Ownership
The general public -- including retail investors -- own 51% of E&P Global Holdings. This level of ownership gives investors from the wider public some power to sway key policy decisions such as board composition, executive compensation, and the dividend payout ratio.
Private Company Ownership
It seems that Private Companies own 10%, of the E&P Global Holdings stock. It's hard to draw any conclusions from this fact alone, so its worth looking into who owns those private companies. Sometimes insiders or other related parties have an interest in shares in a public company through a separate private company.
Next Steps:
While it is well worth considering the different groups that own a company, there are other factors that are even more important. For example, we've discovered 4 warning signs for E&P Global Holdings that you should be aware of before investing here.
If you would prefer check out another company -- one with potentially superior financials -- then do not miss this free list of interesting companies, backed by strong financial data.
NB: Figures in this article are calculated using data from the last twelve months, which refer to the 12-month period ending on the last date of the month the financial statement is dated. This may not be consistent with full year annual report figures.
Have feedback on this article? Concerned about the content? Get in touch with us directly. Alternatively, email editorial-team (at) simplywallst.com.
This article by Simply Wall St is general in nature. We provide commentary based on historical data and analyst forecasts only using an unbiased methodology and our articles are not intended to be financial advice. It does not constitute a recommendation to buy or sell any stock, and does not take account of your objectives, or your financial situation. We aim to bring you long-term focused analysis driven by fundamental data. Note that our analysis may not factor in the latest price-sensitive company announcements or qualitative material. Simply Wall St has no position in any stocks mentioned.
Contact Us
Contact Number :+852 3852 8500Webull Securities Limited is licensed with the Securities and Futures Commission of Hong Kong (CE No. BNG700) for carrying out Type 1 License for Dealing in Securities, Type 2 License for Dealing in Futures Contracts and Type 4 License for Advising on Securities.

English