
Assessing Marketingforce Management (SEHK:2556) Valuation After Launch Of 10% Share Repurchase Program
Marketingforce Management (SEHK:2556) has kicked off a share repurchase program covering up to 10% of its issued share capital, following shareholder approval. This move puts capital allocation and per share metrics in sharper focus for investors.
See our latest analysis for Marketingforce Management.
The repurchase launch has come alongside strong recent momentum, with a 61.77% 30 day share price return and 38.29% year to date share price return, even though the 1 year total shareholder return is a 30.32% decline. Together, this mix of sharp near term gains and weaker 1 year total shareholder return suggests sentiment has recently improved, with investors reacting to the buyback and reassessing the risk profile at the current HK$51.25 share price.
If this buyback has you reassessing the software space, it could be a useful moment to broaden your watchlist with high growth tech and AI stocks that are also seeing rising interest.
With a HK$51.25 share price, double digit revenue growth and a recent loss on the income line, plus a sizeable discount to the average analyst price target, investors may ask whether there is still a buying opportunity here or whether the market is already pricing in future growth.
Price to Sales of 6.7x: Is It Justified?
Marketingforce Management trades on a P/S of 6.7x at a HK$51.25 share price, and the stock currently screens as expensive on this yardstick versus peers.
The P/S multiple compares the company’s market value to its revenue. It is often used for software and other loss making or early stage businesses where earnings are not yet a reliable guide. For Marketingforce Management, this lens is particularly relevant as the company reports CN¥1,747.44m of revenue alongside a loss of CN¥19.11m on the income line.
Simply Wall St’s checks indicate that this 6.7x P/S is higher than both the peer average of 6.1x and the estimated fair P/S of 6.1x. This suggests the market is currently assigning a premium to its revenue despite the company being unprofitable and having a negative return on equity of 1.11%. Compared to the broader Hong Kong Software industry average P/S of 2.3x, the premium is even more pronounced and points to much richer pricing than the sector level that the fair ratio suggests the multiple could trend toward over time.
Explore the SWS fair ratio for Marketingforce Management
Result: Price to Sales of 6.7x (OVERVALUED)
However, you still have to weigh the ongoing loss of CN¥19.11m and the company’s premium 6.7x P/S multiple against peers as potential pressure points.
Find out about the key risks to this Marketingforce Management narrative.
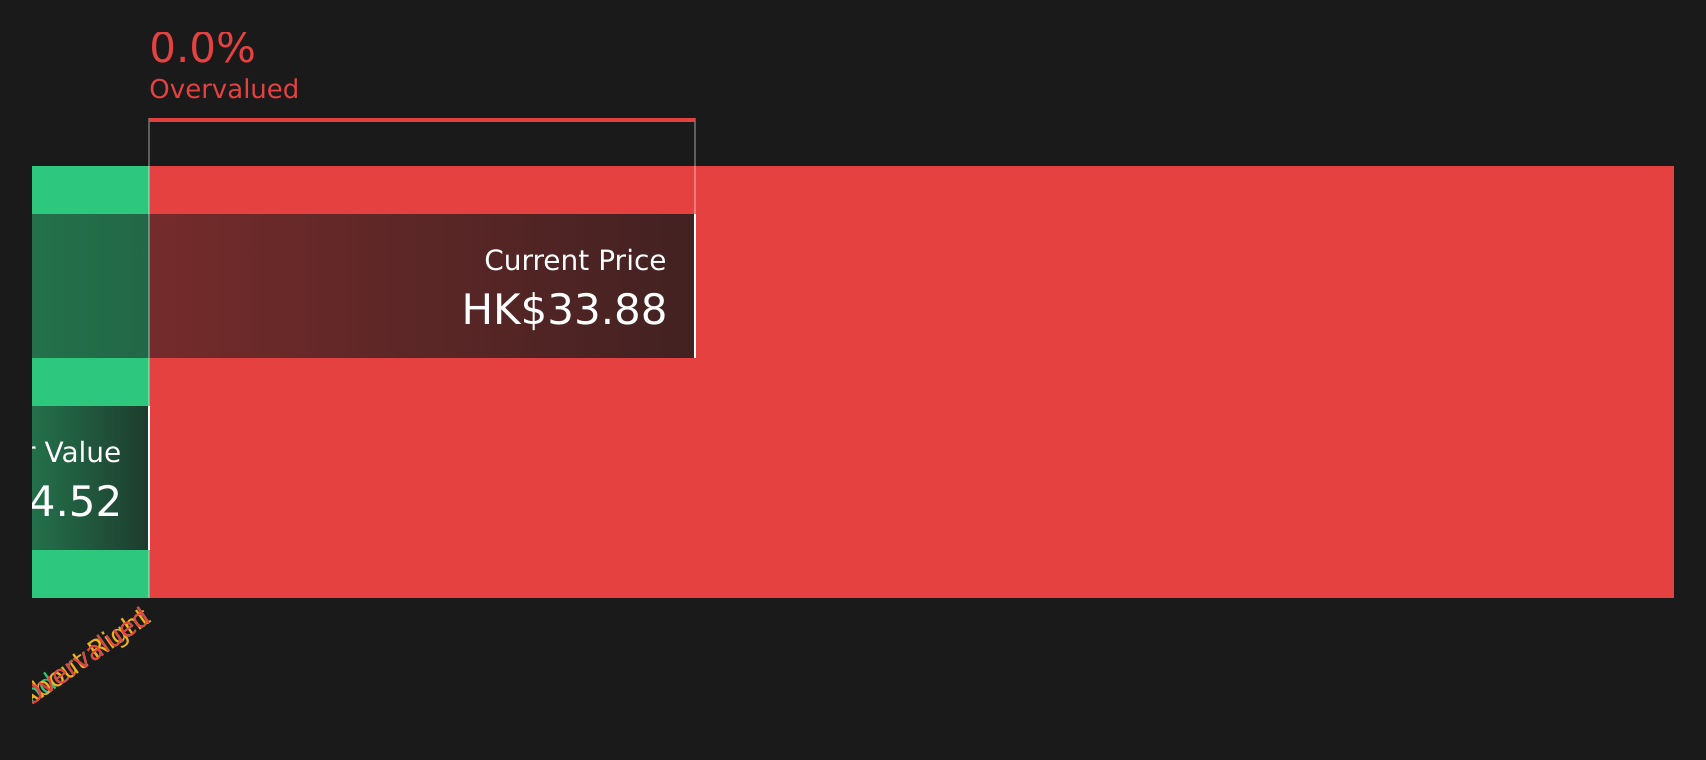
Another View on Value: SWS DCF Check
Our DCF model points to a fair value of HK$39.51, below the current HK$51.25 share price. This suggests Marketingforce Management is trading at a premium on this measure. With one method flagging an expensive P/S and another showing a similar message, where do you think the margin of safety really sits?
Look into how the SWS DCF model arrives at its fair value.
Simply Wall St performs a discounted cash flow (DCF) on every stock in the world every day (check out Marketingforce Management for example). We show the entire calculation in full. You can track the result in your watchlist or portfolio and be alerted when this changes, or use our stock screener to discover 100+ undervalued stocks based on their cash flows. If you save a screener we even alert you when new companies match - so you never miss a potential opportunity.
Build Your Own Marketingforce Management Narrative
Ultimately, if this view does not quite match yours, or you prefer testing the numbers yourself, you can shape a fresh thesis in minutes with Do it your way.
A great starting point for your Marketingforce Management research is our analysis highlighting 1 key reward and 2 important warning signs that could impact your investment decision.
Looking For More Investment Ideas?
If Marketingforce Management has sharpened your thinking, do not stop here. Broaden your opportunity set with focused stock ideas that match how you like to invest.
- Target potential mispricing by scanning these 100+ undervalued stocks based on cash flows that the market may be overlooking based on their cash flow profiles.
- Spot future facing themes by checking out these 27 AI penny stocks that are tied to artificial intelligence trends across different industries.
- Strengthen your income focus by reviewing these 100+ dividend stocks with yields > 3% that offer yields above 3% alongside equity upside potential.
This article by Simply Wall St is general in nature. We provide commentary based on historical data and analyst forecasts only using an unbiased methodology and our articles are not intended to be financial advice. It does not constitute a recommendation to buy or sell any stock, and does not take account of your objectives, or your financial situation. We aim to bring you long-term focused analysis driven by fundamental data. Note that our analysis may not factor in the latest price-sensitive company announcements or qualitative material. Simply Wall St has no position in any stocks mentioned.
Have feedback on this article? Concerned about the content? Get in touch with us directly. Alternatively, email editorial-team@simplywallst.com
Contact Us
Contact Number :+852 3852 8500Webull Securities Limited is licensed with the Securities and Futures Commission of Hong Kong (CE No. BNG700) for carrying out Type 1 License for Dealing in Securities, Type 2 License for Dealing in Futures Contracts and Type 4 License for Advising on Securities.

English