
Is Zebra Technologies (ZBRA) Pricing Reflect A Recovery After Last Year’s 33% Share Price Fall
- If you are wondering whether Zebra Technologies is attractively priced right now, this article walks through what the current share price might be implying about the company’s value.
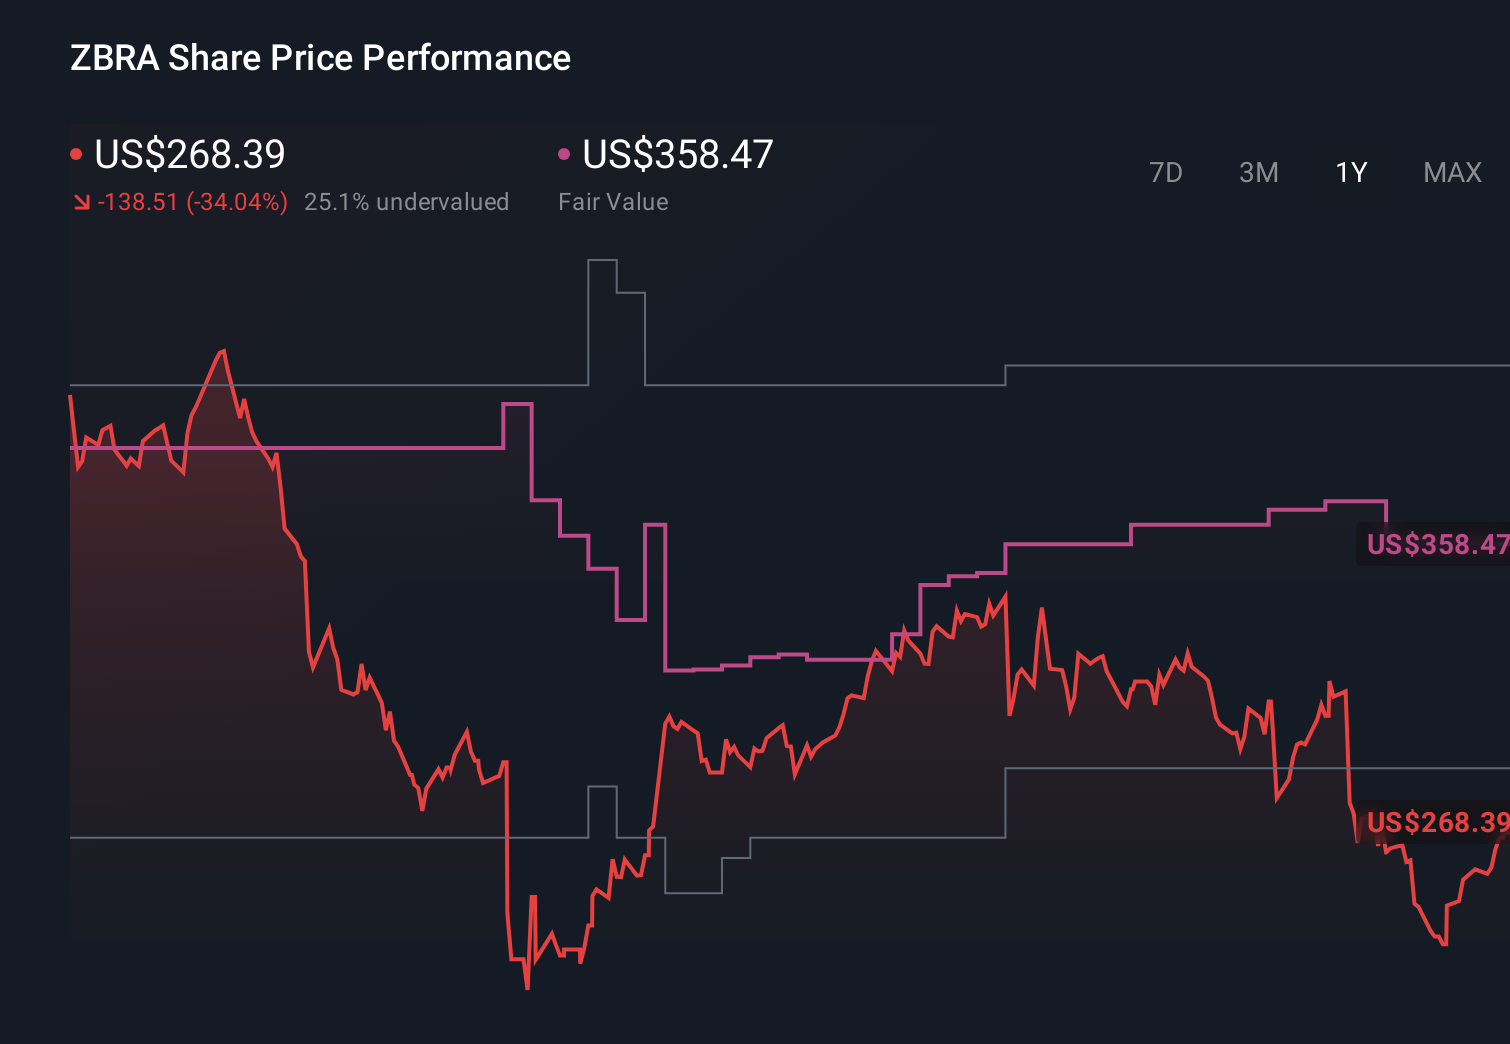
- The stock recently closed at US$261.44, with returns of 1.5% over the last 7 days, a 2.6% decline over the last 30 days, a 5.3% gain year to date and a 33.7% decline over the last year. These figures can change how investors view both its potential and its risks.
- Recent headlines have focused on Zebra Technologies as investors reassess barcode, scanning and enterprise asset intelligence companies in light of changing demand across logistics and retail. These developments help explain why the share price has moved in different directions over shorter and longer time frames.
- On Simply Wall St’s valuation checks, Zebra Technologies scores 6 out of 6. Next, we will look at how methods like discounted cash flow and valuation multiples stack up against that score, before finishing with a more complete way to think about what the stock might be worth.
Find out why Zebra Technologies's -33.7% return over the last year is lagging behind its peers.
Approach 1: Zebra Technologies Discounted Cash Flow (DCF) Analysis
A Discounted Cash Flow, or DCF, model estimates what a company could be worth by projecting its future cash flows and discounting them back to today’s value.
For Zebra Technologies, the model used is a 2 Stage Free Cash Flow to Equity approach. The latest twelve month free cash flow is about $786.8 million. Analysts and internal estimates project free cash flow reaching around $1,059.0 million by 2029, with further projections out to 2035 generated by Simply Wall St. All of these cash flows are in US$.
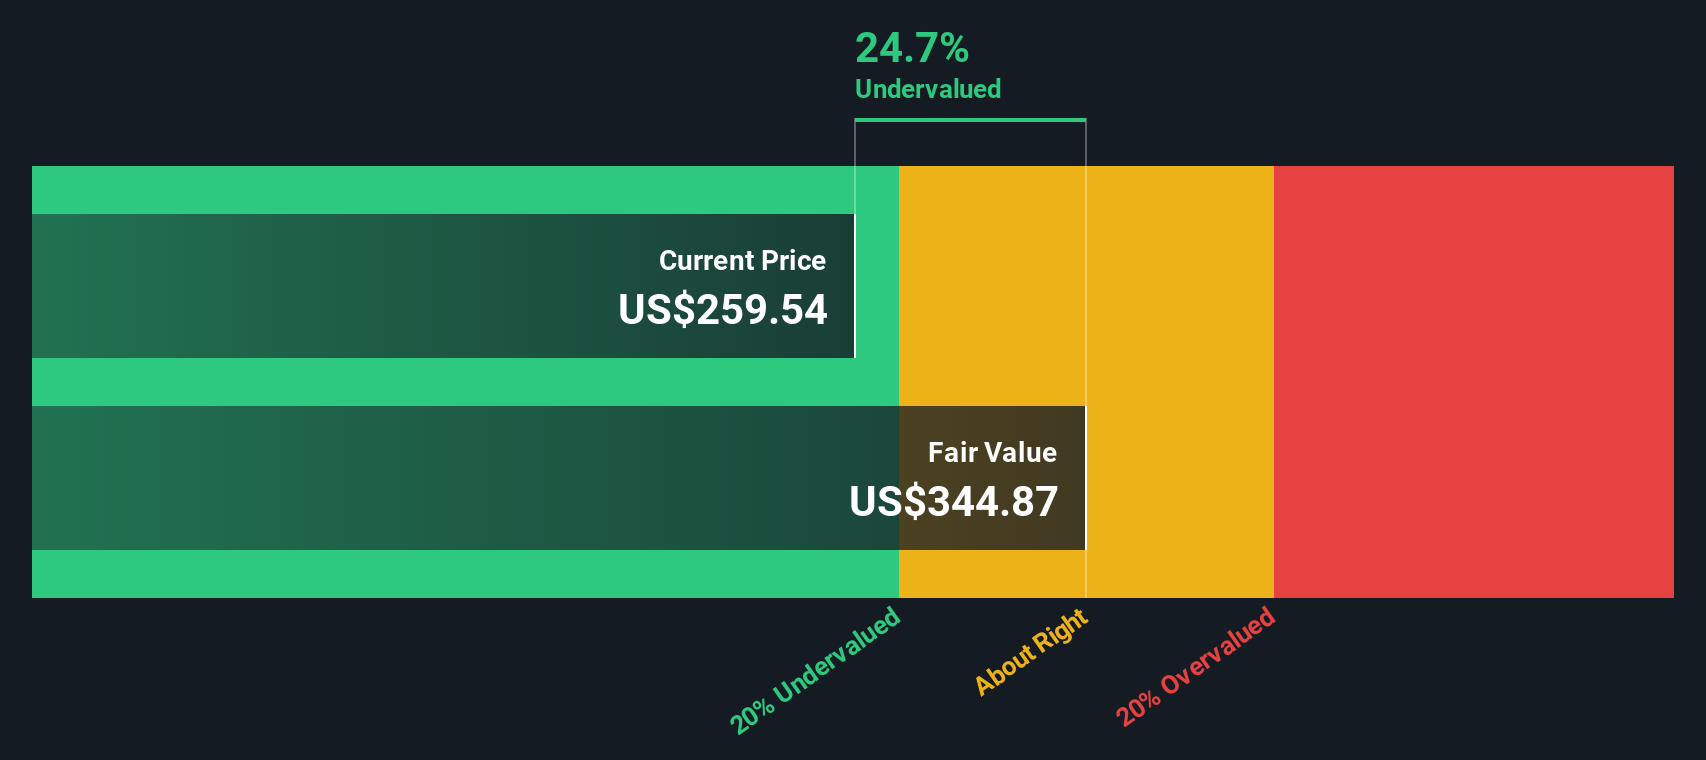
When those projected cash flows are discounted back and added up, the model arrives at an estimated intrinsic value of about $344.75 per share. Compared with the recent share price of $261.44, the DCF output implies that, on this model, Zebra Technologies trades at a 24.2% discount.
Result: Trades at a 24.2% discount on this DCF model
Our Discounted Cash Flow (DCF) analysis suggests Zebra Technologies is undervalued by 24.2%. Track this in your watchlist or portfolio, or discover 884 more undervalued stocks based on cash flows.
Approach 2: Zebra Technologies Price vs Earnings (P/E)
For profitable companies, the P/E ratio is a useful way to think about valuation because it links what you pay today to the earnings the business is already generating. A higher or lower P/E often reflects what the market is factoring in around future growth and how risky those earnings might be.
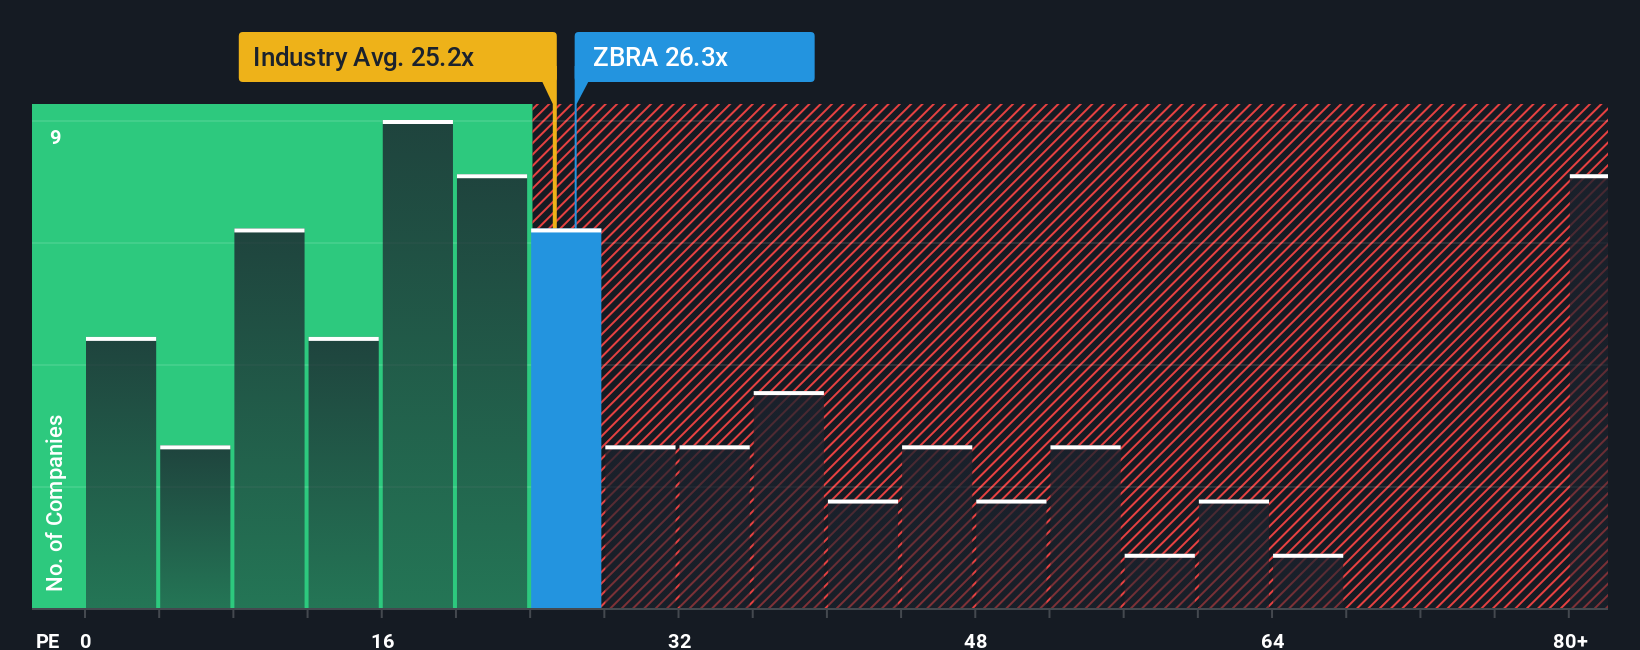
Zebra Technologies currently trades on a P/E of 25.9x. That sits below the peer group average of 41.6x and also below the Electronic industry average of about 27.1x. On the surface, that suggests the market is valuing Zebra’s earnings at a lower level than many similar businesses.
Simply Wall St’s Fair Ratio takes this a step further. It is a proprietary estimate of what Zebra’s P/E might be expected to be, given factors such as its earnings growth profile, profit margins, industry, market cap and specific risks. Because it uses company specific inputs rather than broad group averages, it can give a more tailored view than a simple peer or sector comparison. For Zebra, the Fair Ratio is 29.9x, which is higher than the current 25.9x. This indicates the shares may be undervalued on this metric.
Result: UNDERVALUED
P/E ratios tell one story, but what if the real opportunity lies elsewhere? Discover 1443 companies where insiders are betting big on explosive growth.
Upgrade Your Decision Making: Choose your Zebra Technologies Narrative
Earlier we mentioned that there is an even better way to understand valuation. Narratives on Simply Wall St give you a simple way to write your story for Zebra Technologies, link that story to a forecast for revenue, earnings and margins, and then see a Fair Value that you can compare with the current price to help decide whether you are closer to buying or selling. Each Narrative sits inside the Community page and updates automatically as new news or earnings arrive. For example, one investor might lean toward a higher fair value near US$421 if they think tariff headwinds ease and acquisitions support long term margins. Another might sit closer to US$300 if they are more cautious about hardware reliance and competitive risks. Both of those views, plus the consensus fair value of about US$358.47, can coexist and adjust over time as fresh information comes in.
Do you think there's more to the story for Zebra Technologies? Head over to our Community to see what others are saying!
This article by Simply Wall St is general in nature. We provide commentary based on historical data and analyst forecasts only using an unbiased methodology and our articles are not intended to be financial advice. It does not constitute a recommendation to buy or sell any stock, and does not take account of your objectives, or your financial situation. We aim to bring you long-term focused analysis driven by fundamental data. Note that our analysis may not factor in the latest price-sensitive company announcements or qualitative material. Simply Wall St has no position in any stocks mentioned.
Have feedback on this article? Concerned about the content? Get in touch with us directly. Alternatively, email editorial-team@simplywallst.com
Contact Us
Contact Number : +852 3852 8500Webull Securities Limited is licensed with the Securities and Futures Commission of Hong Kong (CE No. BNG700) for carrying out Type 1 License for Dealing in Securities, Type 2 License for Dealing in Futures Contracts and Type 4 License for Advising on Securities.

English