
Sunac China Holdings (SEHK:1918) Valuation Check After Latest Contracted Sales Update
Sunac China Holdings (SEHK:1918) has drawn fresh attention after reporting unaudited contracted sales for December 2025 and the full year, giving investors a clearer view of recent project activity and buyer demand.
See our latest analysis for Sunac China Holdings.
The latest unaudited contracted sales update lands after a mixed trading stretch, with a 1 day share price return of 3.45% and a 7 day gain of 1.69%. This is set against a 90 day share price return showing a 21.05% decline and a 1 year total shareholder return showing a 25% loss, which together suggest recent momentum is still trying to recover.
If this sales update has you rethinking your exposure to Chinese property, it could be a good moment to broaden your search and check out fast growing stocks with high insider ownership.
With the share price down sharply over 1 year and a very high modelled intrinsic discount, yet trading close to analyst targets, you have to ask: is Sunac China a mispriced recovery story, or is the market already pricing in future growth?
Price-to-Sales of 0.2x: Is it justified?
On a P/S of 0.2x at the last close of HK$1.20, Sunac China looks cheap compared with both its estimated fair P/S level and the wider Hong Kong real estate group.
The P/S ratio compares the company’s market value to its revenue. This can be useful for businesses that are currently loss making, like Sunac China, where earnings-based metrics such as P/E are less informative.
For Sunac China, a 0.2x P/S sits below the estimated fair P/S of 0.4x. This points to the market assigning a lower value to each unit of sales than the SWS fair ratio suggests. At the same time, this 0.2x P/S is also below the Hong Kong real estate industry average of 0.7x, a gap that indicates investors are pricing its revenue stream more cautiously than both the sector benchmark and the level our fair ratio model indicates the market could move towards.
Explore the SWS fair ratio for Sunac China Holdings
Result: Price-to-Sales of 0.2x (UNDERVALUED)
However, you still need to weigh a recent 9.9% annual revenue decline alongside a HK$23,546.674m net loss. Both factors raise questions about how durable any recovery case really is.
Find out about the key risks to this Sunac China Holdings narrative.
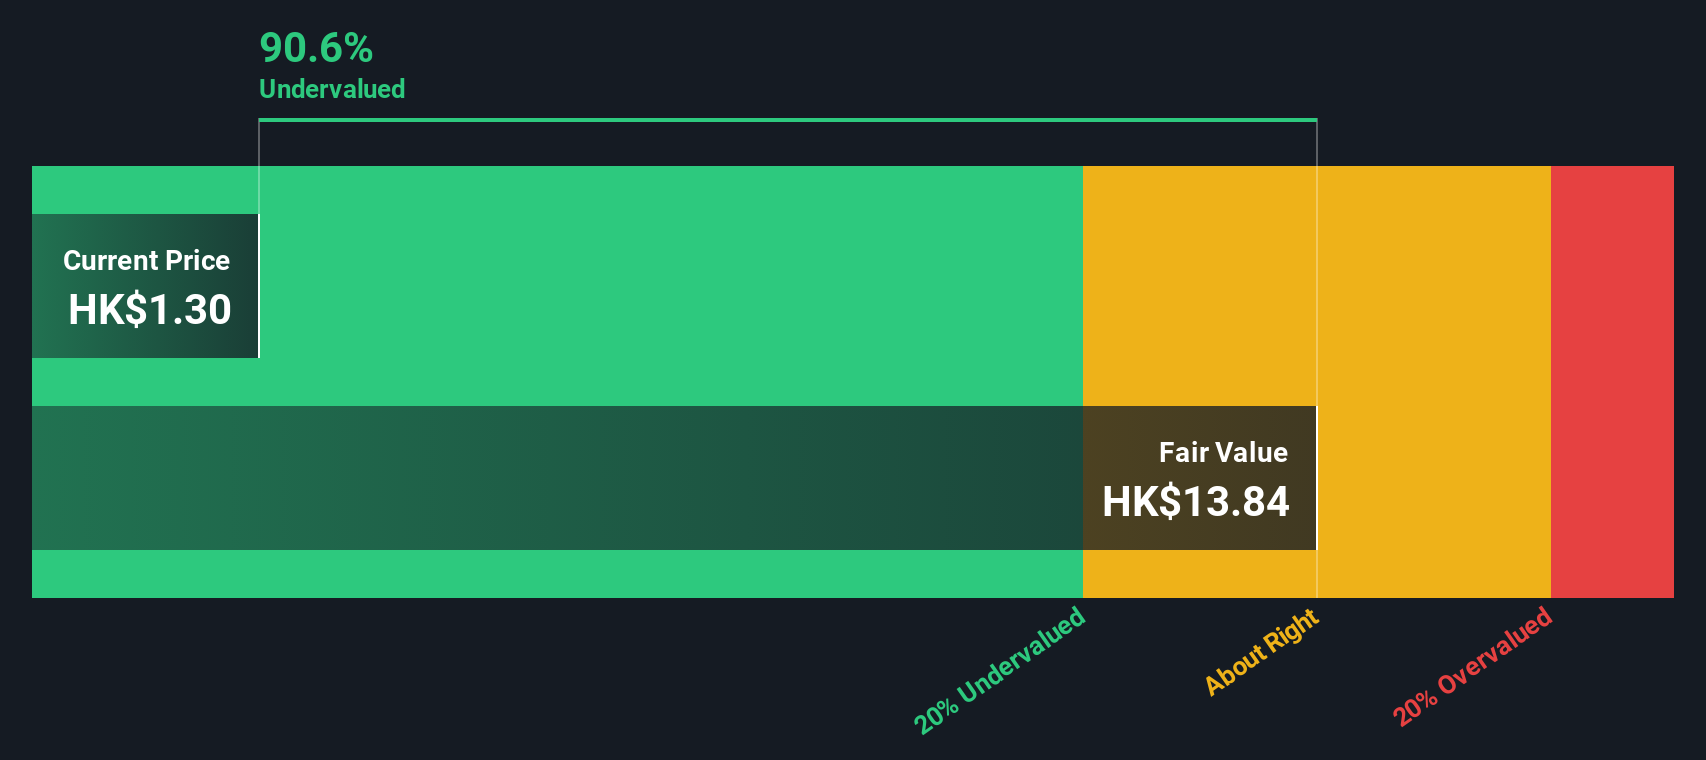
Another View: What Our DCF Model Suggests
While the 0.2x P/S ratio points to Sunac China looking inexpensive, our DCF model presents an even starker picture. It suggests a fair value around HK$12.73 per share versus the current HK$1.20, which indicates a very large discount. This raises an important question: is this a genuine opportunity or a sign that cash flow risk is high?
Look into how the SWS DCF model arrives at its fair value.
Simply Wall St performs a discounted cash flow (DCF) on every stock in the world every day (check out Sunac China Holdings for example). We show the entire calculation in full. You can track the result in your watchlist or portfolio and be alerted when this changes, or use our stock screener to discover 886 undervalued stocks based on their cash flows. If you save a screener we even alert you when new companies match - so you never miss a potential opportunity.
Build Your Own Sunac China Holdings Narrative
If you look at this data and reach a different conclusion, or simply want to shape the story yourself, you can build a custom view in minutes: Do it your way.
A great starting point for your Sunac China Holdings research is our analysis highlighting 1 key reward and 2 important warning signs that could impact your investment decision.
Ready for more investment ideas?
If Sunac China has sharpened your thinking, do not stop here, use the Simply Wall St Screener to spot more focused opportunities that fit your style.
- Target potential bargains by scanning these 886 undervalued stocks based on cash flows that trade at lower valuations relative to their cash flows and fundamentals.
- Tap into growth themes by checking out these 25 AI penny stocks that are tied to artificial intelligence trends across different parts of the market.
- Add income ideas to your watchlist by filtering for these 12 dividend stocks with yields > 3% that may help support a steadier return profile.
This article by Simply Wall St is general in nature. We provide commentary based on historical data and analyst forecasts only using an unbiased methodology and our articles are not intended to be financial advice. It does not constitute a recommendation to buy or sell any stock, and does not take account of your objectives, or your financial situation. We aim to bring you long-term focused analysis driven by fundamental data. Note that our analysis may not factor in the latest price-sensitive company announcements or qualitative material. Simply Wall St has no position in any stocks mentioned.
Have feedback on this article? Concerned about the content? Get in touch with us directly. Alternatively, email editorial-team@simplywallst.com
Contact Us
Contact Number : +852 3852 8500Webull Securities Limited is licensed with the Securities and Futures Commission of Hong Kong (CE No. BNG700) for carrying out Type 1 License for Dealing in Securities, Type 2 License for Dealing in Futures Contracts and Type 4 License for Advising on Securities.

English